Geopolitics & Economy

The Price of Escalation

From oil markets to airline stocks, the economic shockwaves of the US-Iran conflict are reshaping portfolios, supply chains, and consumer wallets in real time.

Listen
An amber-lit cracked globe leaking oil onto a financial trading floor, symbolizing the economic fractures of the US-Iran conflict
01

Brent Breaches $82 — and Analysts Fear $120 Is Next

Oil refinery at sunset with tanker ships silhouetted against an amber sky

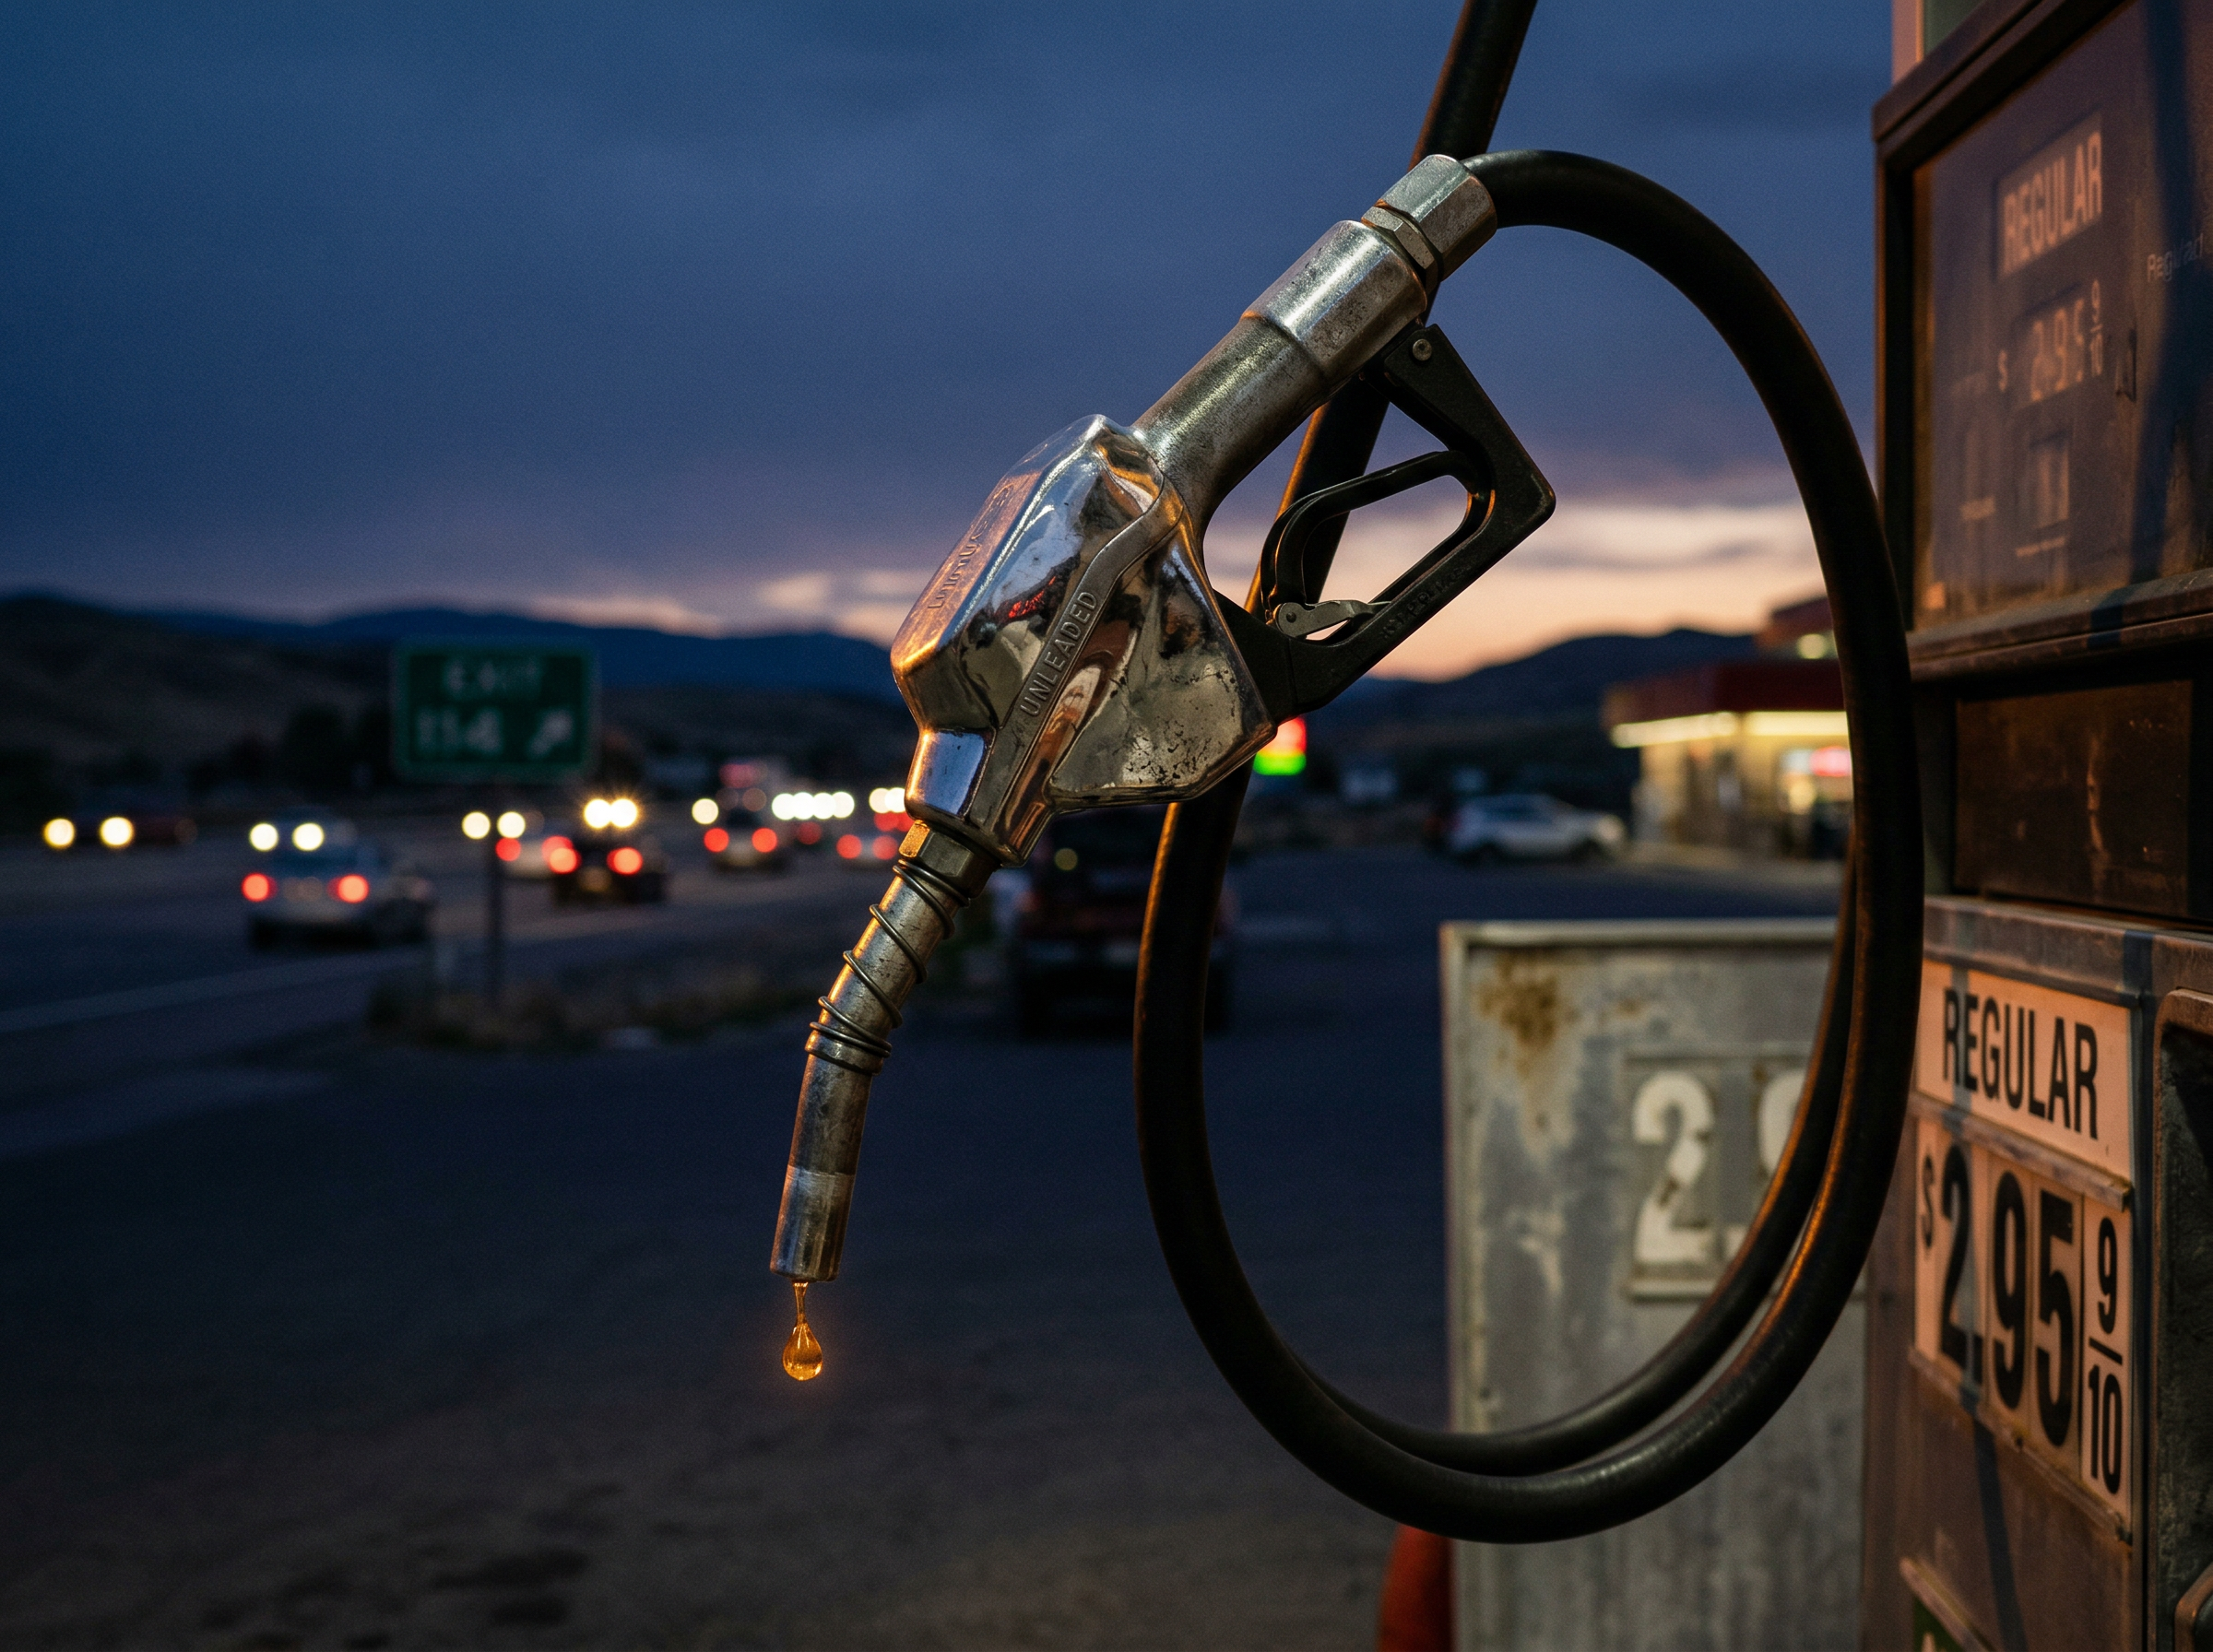
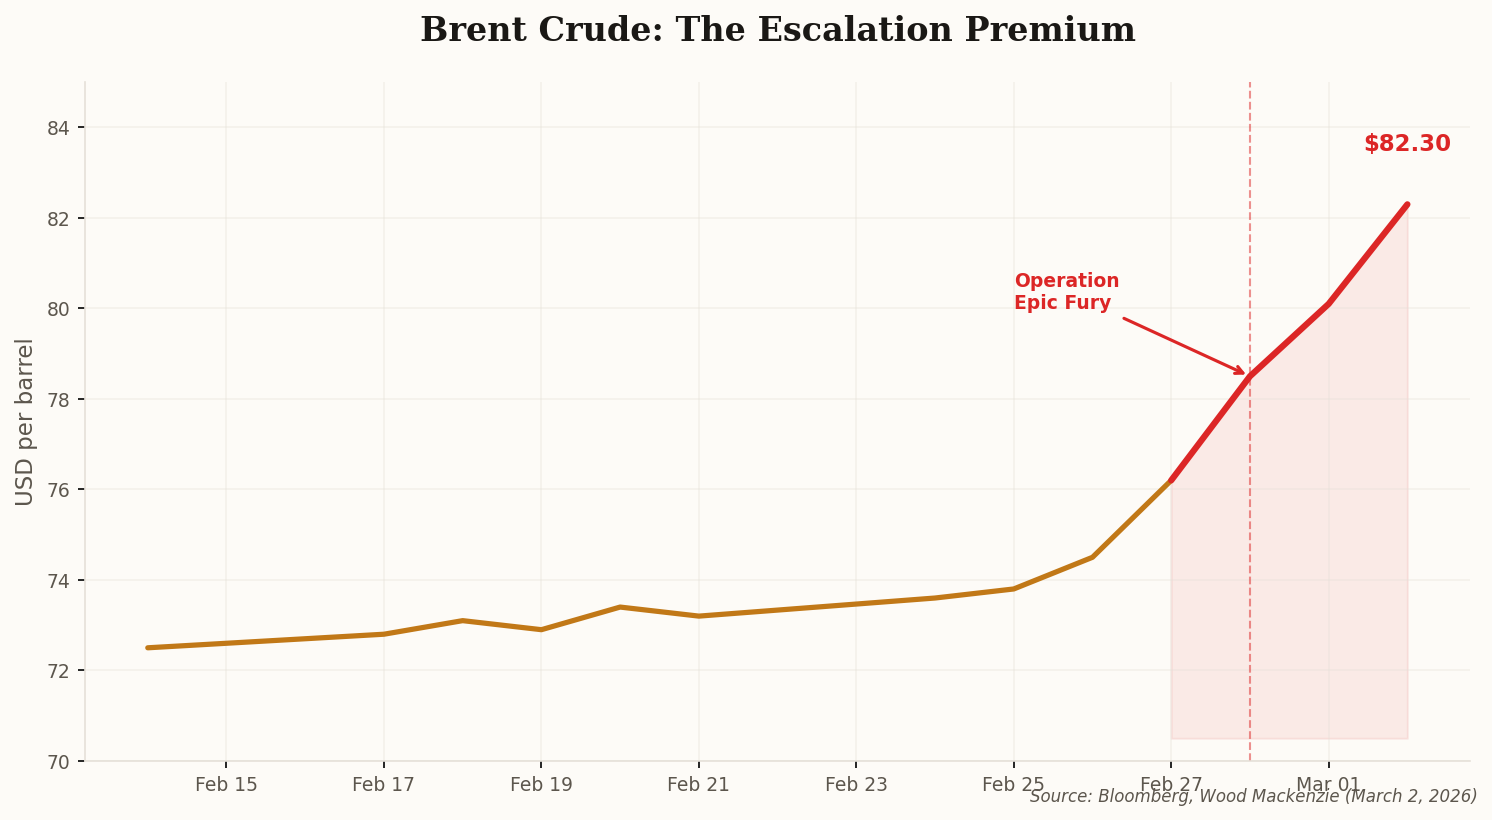
When Operation Epic Fury launched on February 28, oil traders didn't wait for confirmation of supply disruptions. They priced them in immediately. Brent crude surged between 10% and 13% in the first trading sessions of March, briefly topping $82 per barrel — a level that looked unthinkable two weeks ago when oil was languishing in the low $70s.

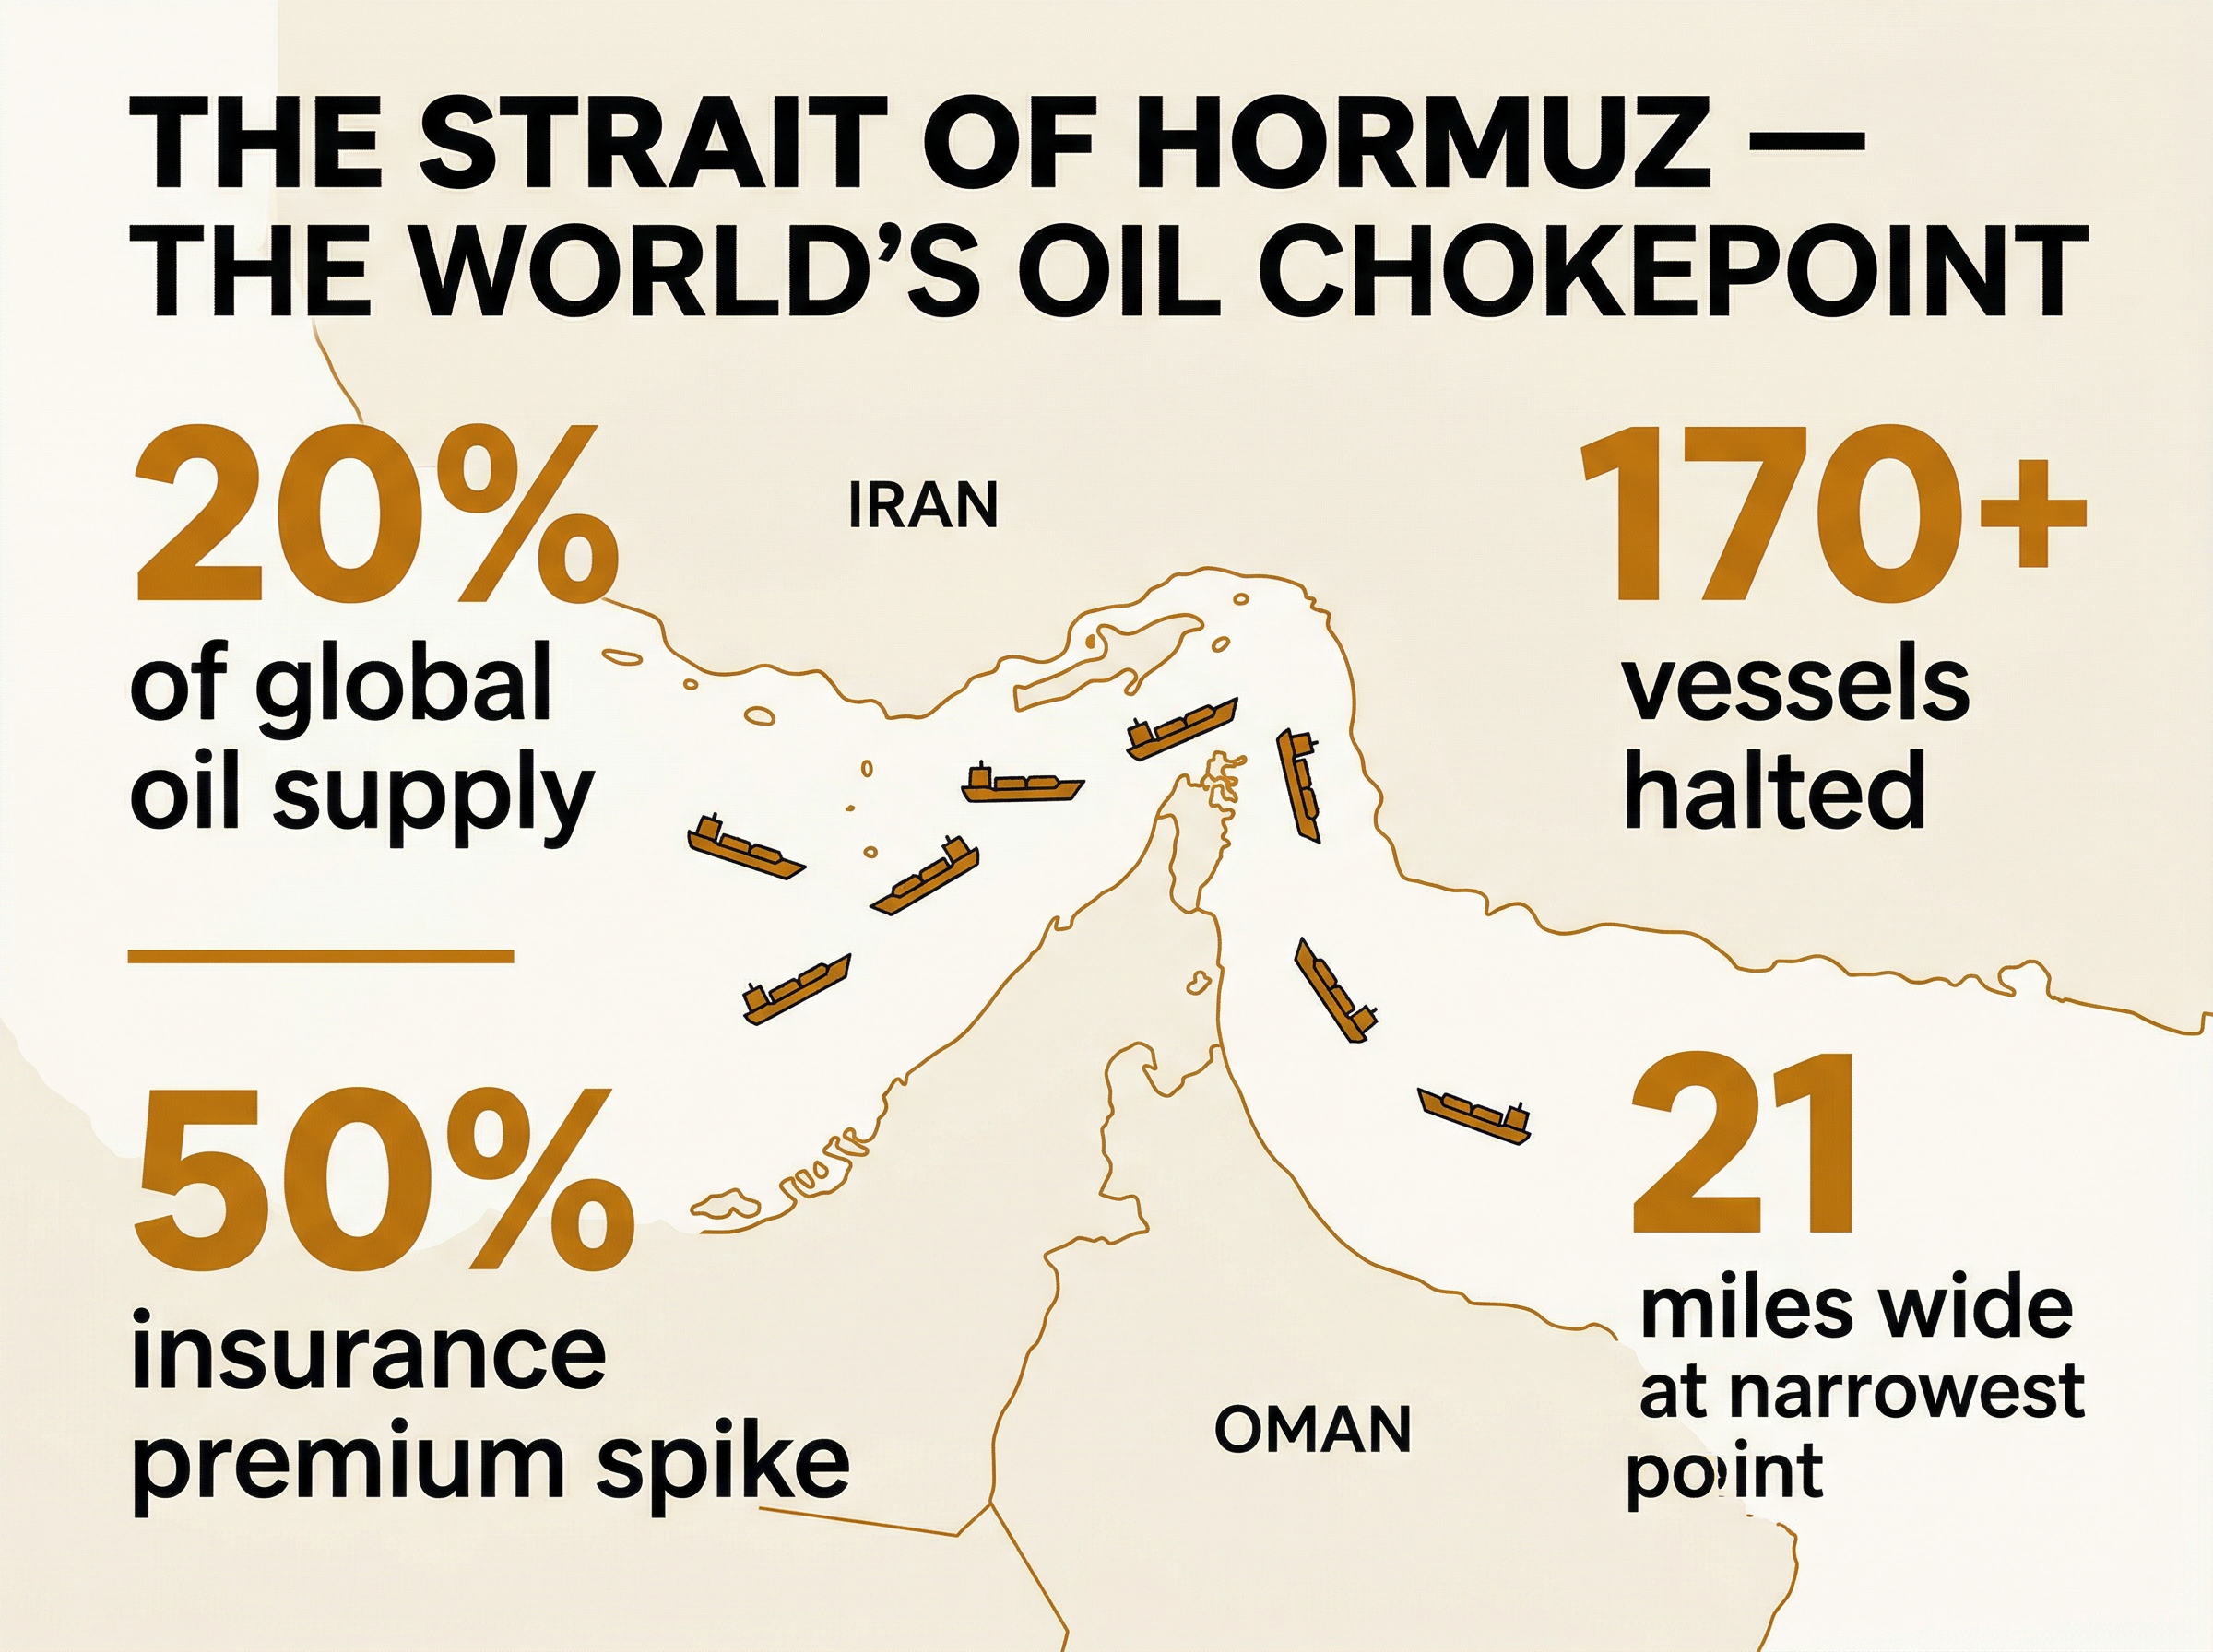
The number that should keep you up at night isn't $82. It's $120. That's where Wood Mackenzie analysts project prices could land if the Strait of Hormuz — through which 20% of the world's oil supply transits daily — faces a prolonged blockade. "The market is pricing in a worst-case scenario where 20% of the world's oil supply is effectively sidelined," one commodity strategist told Bloomberg.

Line chart showing Brent crude price spiking from $73 to $82 per barrel following Operation Epic Fury on February 28, 2026
Brent crude trajectory: two weeks of stability shattered by three days of escalation. The red zone shows the conflict premium.

The critical variable is duration. A 48-hour flare-up fades from trading screens within a week. A sustained campaign through Hormuz territory rewrites global energy economics for a generation. Every day the strait remains effectively closed adds roughly $2-3 to the per-barrel price floor, according to energy analysts. This isn't 2020's demand destruction in reverse — it's supply destruction, the kind that doesn't respond to OPEC phone calls or SPR releases.

02

The $3.00 Gallon Returns: Energy Shock Hits American Wallets

A gas pump nozzle with amber fuel dripping against a blurred American highway at dusk

Forget the barrel price — here's the number Americans actually feel: $3.00 per gallon. National average retail gasoline broke that threshold on March 2, marking the first time in 2026 that the psychological barrier has fallen. In January, drivers were paying $2.45. That $0.55 swing happened in less than six weeks, and it's accelerating.

The Northeast and West Coast are getting hit hardest. Retailers in those regions report price jumps of $0.15 to $0.25 in a single 24-hour period — the kind of spike that generates local news segments and angry tweets. "The energy shock is hitting American pumps at a time when consumer confidence was just beginning to stabilize," AAA noted in its morning briefing.

What makes this particularly painful is timing. The Federal Reserve spent 18 months wrestling inflation down. Consumer sentiment surveys from the University of Michigan had just started trending positive. Now every fill-up is a reminder that geopolitics can vaporize domestic economic progress in 72 hours. The historical pattern is clear: every $0.10 increase at the pump reduces U.S. consumer spending by roughly $11 billion annually. Do the math on $0.55.

03

Risk-Off Rules: From Tokyo to London, Equities Bleed

Abstract geometric shapes cascading downward representing falling stock markets

Monday morning's opening bell was more of a funeral dirge. U.S. futures for the S&P 500, Dow Jones, and Nasdaq fell between 1.1% and 1.5% at the open — losses that sound modest until you calculate the billions in household wealth they represent.

Asia got there first. Japan's Nikkei 225 dropped 1.35%, while Hong Kong's Hang Seng plummeted 2.14% — the sharpest single-session decline since the August 2025 correction. The UK's FTSE 100 shed nearly 1%. Across every major exchange, the pattern was identical: a massive rotation out of equities and into bonds, gold, and cash. "Risk-off" isn't just a trading memo — it's a collective decision by institutional money to hide under the bed.

The deeper concern isn't the headline numbers. It's what broad market declines do to corporate behavior. When portfolio values drop, CFOs defer capital expenditure. When CFOs defer capex, hiring slows. When hiring slows, consumer spending contracts further. The self-reinforcing cycle has a name: the wealth effect in reverse. And it's already spinning.

04

The World's Most Important Bottleneck Just Closed

Aerial view of container ships anchored in a long queue at the Strait of Hormuz at twilight

Three letters — MSC, Maersk, and CMA CGM — control the arteries of global trade. On March 1, all three officially suspended operations through the Strait of Hormuz. Approximately 170-200 commercial vessels now sit anchored outside the chokepoint, burning fuel while going nowhere. The de facto closure affects 20% of global oil and significant volumes of LNG.

Infographic showing the Strait of Hormuz as a global oil chokepoint: 20% of world oil supply, 170+ vessels halted, 50% insurance premium spike, 21 miles wide at narrowest point
The Strait of Hormuz: 21 miles of water that the global economy cannot do without — Generated with Nano Banana 2.0

But here's the detail that turns a shipping disruption into an economic restructuring event: war risk insurance premiums have spiked 50%. For a vessel valued at $100 million, per-voyage coverage jumped from $250,000 to approximately $375,000. Annualized, single-vessel operations could face insurance costs of $150-200 million. "Major insurers are effectively withdrawing capacity, leaving dozens of tankers stranded without coverage," Reinsurance News reported.

The insurance spike creates a functional blockade even without a physical one. Ships that could sail can't afford to. Rerouting around the Cape of Good Hope adds 10-14 days to Asia-Europe transits, inflating freight rates across every sector — not just energy. The container you're waiting on doesn't care whether it's carrying crude or consumer electronics.

05

Defense Stocks Soar While Airlines Crash

Split composition: a fighter jet ascending against amber sky on the left, a grounded commercial airplane behind a fence in blue shadow on the right

The same event that destroyed airline valuations made defense contractors the best trade on Wall Street. RTX Corporation reported a record backlog of $268 billion. Lockheed Martin shares rose 2.5% to $654 in a single session. Northrop Grumman reached a $95 billion backlog for tactical systems and munitions.

Bar chart showing defense stocks up 2-3% while airline stocks down 5-9% in a single trading session
The market's split personality: defense contractors gained what airlines lost, and then some. TUI Group took the heaviest single-session hit at -9%.

On the other side of the ledger: Lufthansa, IAG (British Airways), and TUI Group dropped between 5% and 9%. The total closure of Iranian and surrounding airspace is forcing expensive long-haul reroutes. Analysts expect operating costs for East-West routes to jump 15-20%. "The aviation sector is facing its most significant operational disruption since the total closure of Russian airspace in 2022," one industry analyst told The Guardian.

The philosophical question behind the numbers: investors are now treating defense stocks as "subscription-like assets," with 70% of revenue tied to long-term maintenance and software contracts. What does it mean when the market's most reliable dividend plays are companies whose revenue model depends on permanent conflict? Capital is flowing away from consumer tech and into what some economists are calling a "permanent war economy." The portfolio implications are sobering.

06

The Inflation Ghost Returns: Rate Cuts Delayed, Recovery Stalled

A thermometer with rising amber-gold mercury representing inflation against blurred Federal Reserve building columns

Here's the macroeconomic punchline nobody wanted to hear: the energy shock is projected to add 0.1 to 0.3 percentage points to headline CPI in both the U.S. and Europe. January's inflation reading was a manageable 2.4%. Analysts now expect March to spike above 2.7%. "The last mile of the inflation fight just got significantly longer and more expensive," Allianz Global Investors wrote in a client note.

Line chart comparing pre-conflict and post-conflict CPI inflation projections, showing a widening gap from March 2026 onward
The conflict premium on inflation: pre-war projections had CPI gliding toward 2.1% by May. Post-war projections show it stuck above 2.6%, with rate cuts delayed indefinitely.

The Fed's dilemma is now a trilemma. Option one: cut rates as planned to support slowing growth, accepting higher inflation. Option two: hold rates steady, risking a consumer-led recession as energy costs drain spending power. Option three: hike rates to fight the energy-driven inflation spike, crushing an already fragile housing market. None of these options are good. All of them are now on the table.

Persistent inflation at the 2.7% level keeps borrowing costs elevated for businesses expanding operations, homeowners refinancing mortgages, and governments financing deficits. The post-pandemic recovery playbook assumed a steady decline to the 2% target. That assumption died somewhere in the Strait of Hormuz. Every month the conflict persists delays the eventual rate-cutting cycle by roughly the same duration — a one-for-one destruction of monetary policy flexibility.

The Meter Is Running

War is always expensive. But this particular war touches every economic pressure point simultaneously: energy supply, shipping routes, consumer confidence, corporate investment, and central bank credibility. The question isn't whether there will be economic damage — it's whether the damage stays contained at "expensive inconvenience" or escalates to "generational restructuring." Watch the Strait. That's where the answer lives.