U.S. Fiscal Policy

The Rate of Change

Fifty years of American tax brackets tell the story of who we think should pay for civilization — and how much we keep changing our minds about it.

Listen
Abstract illustration of cascading tax brackets across five decades, rendered as architectural layers descending from a 91% cathedral ceiling to the 37% floor
1950s America through a fiscal lens, showing the impossibly high 91% tax ceiling
01

The 91% Ceiling Nobody Actually Hit

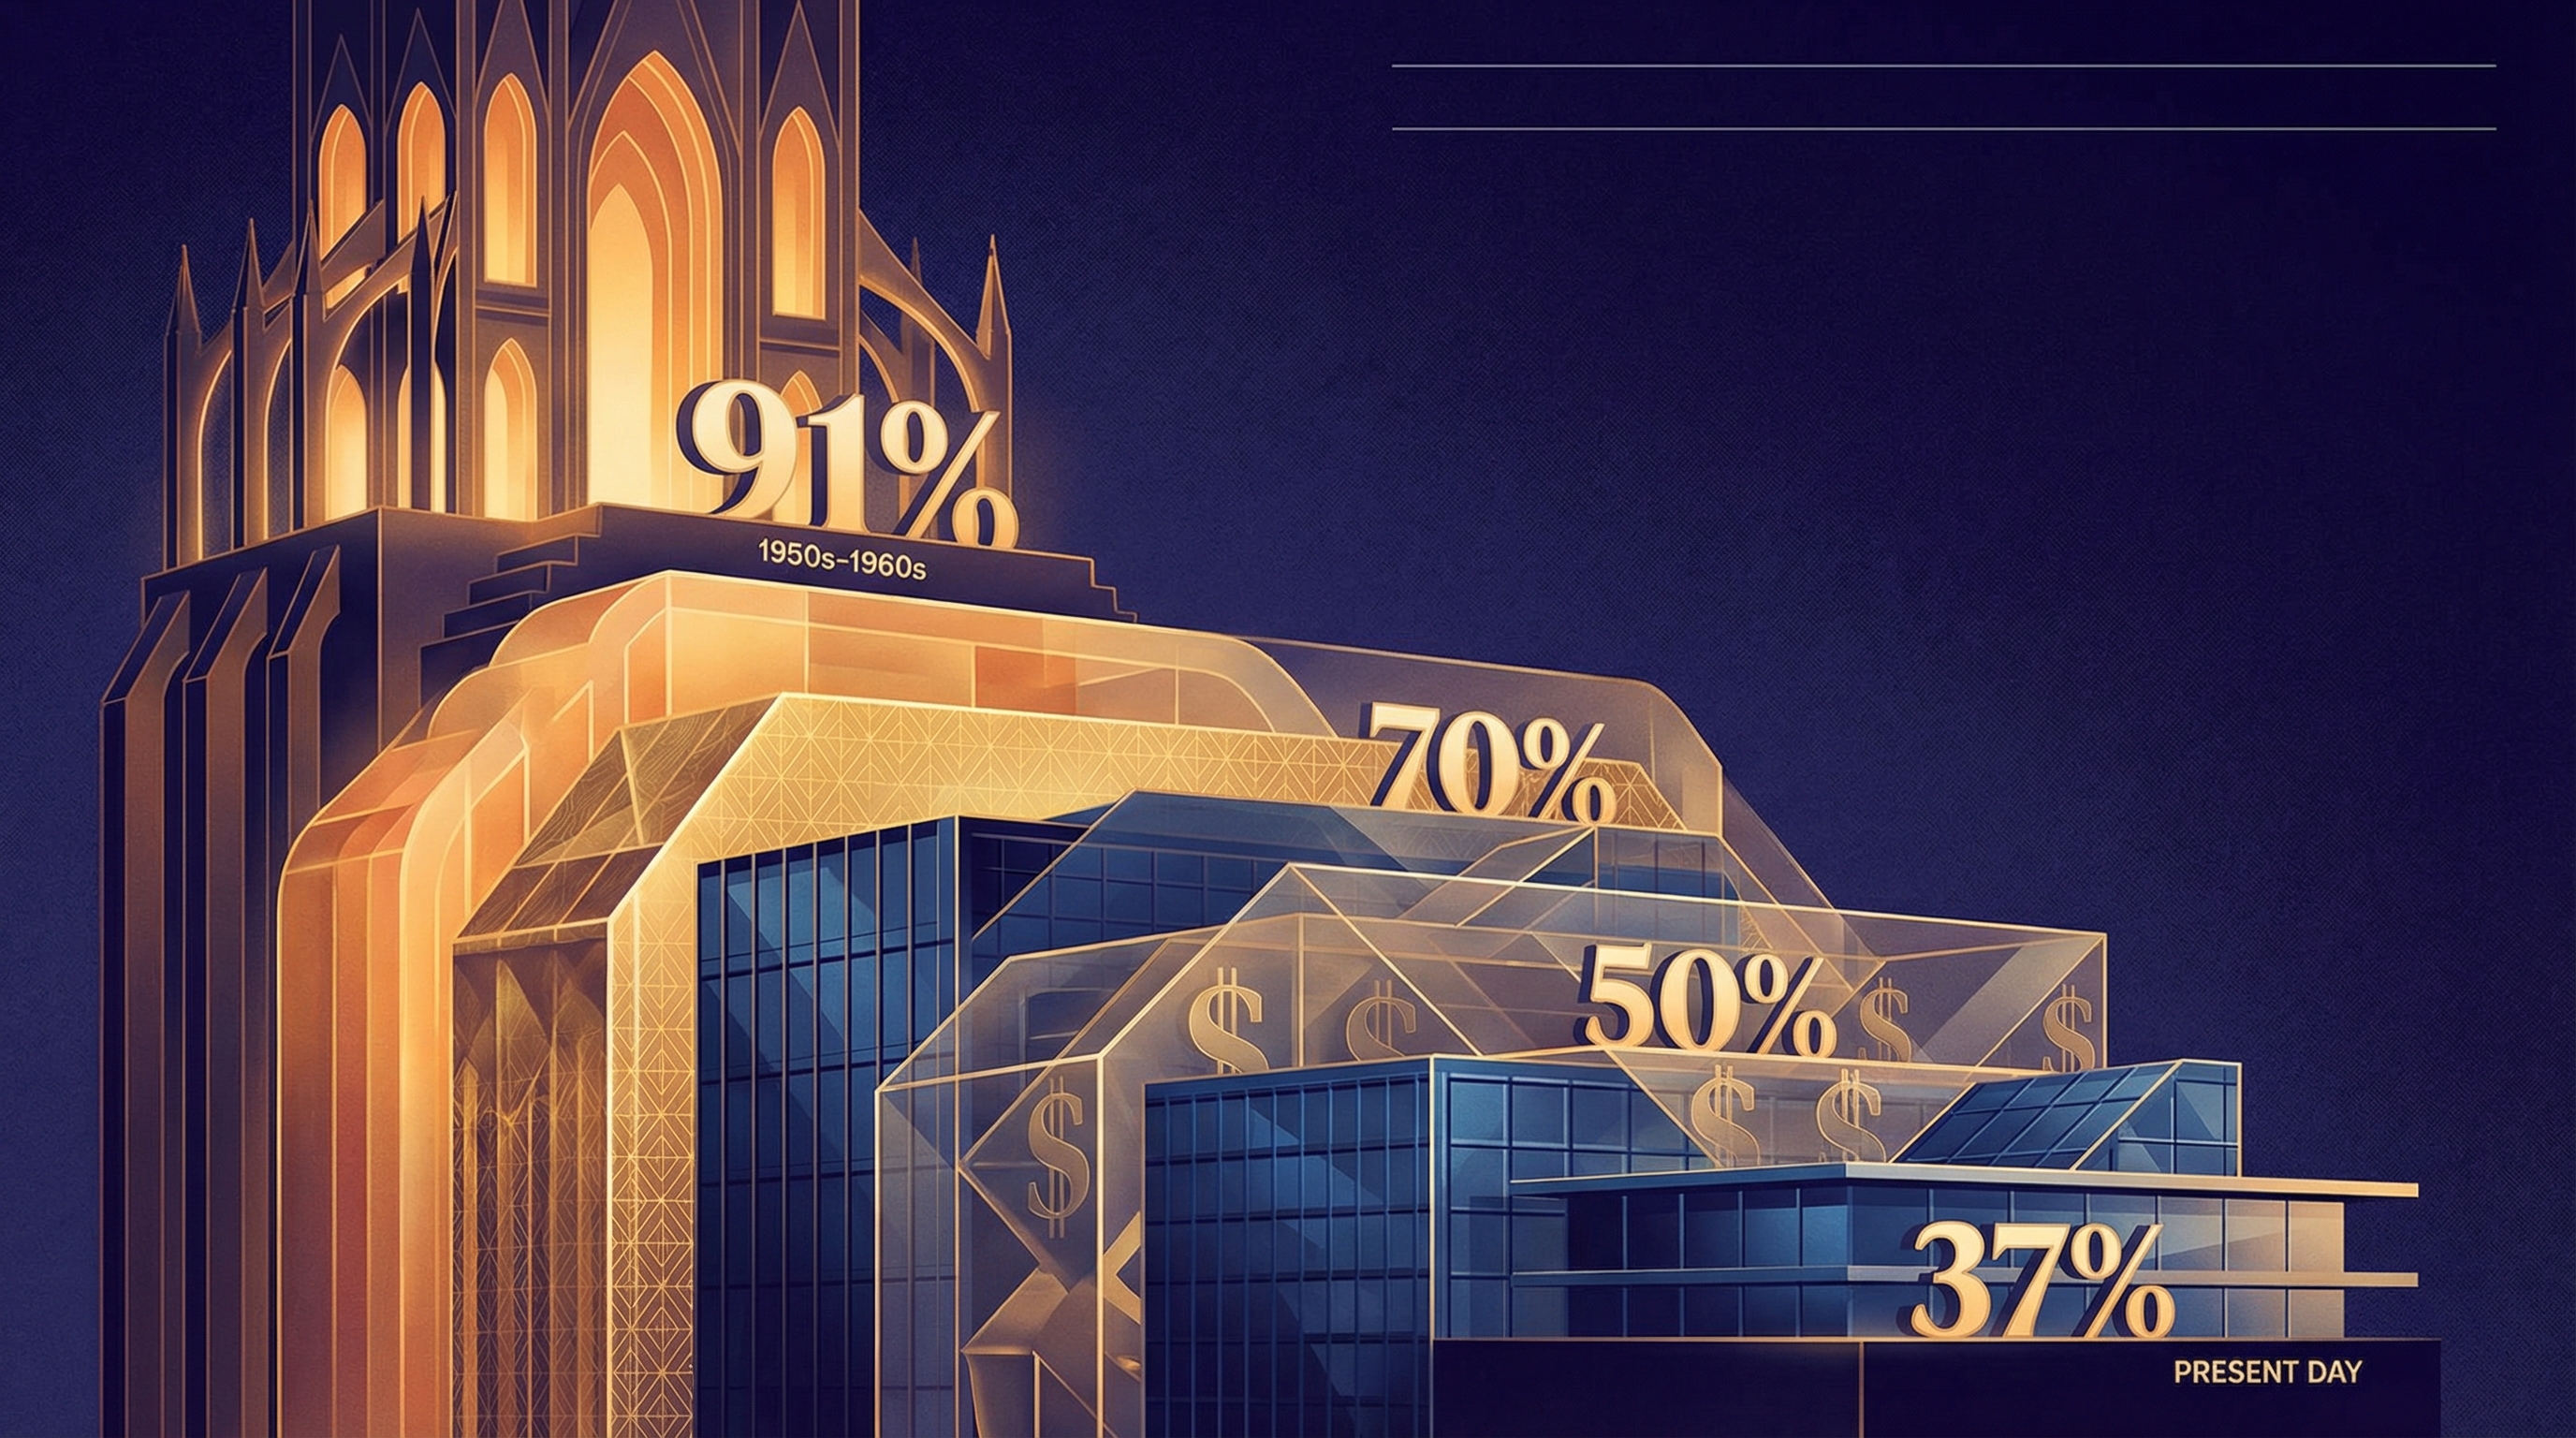
Before we talk about where tax rates went over the last fifty years, we need to talk about where they came from. In 1944, the top marginal rate hit 94% on income above $200,000 — roughly $3.4 million in today's dollars. It wasn't a typo. It was a war.

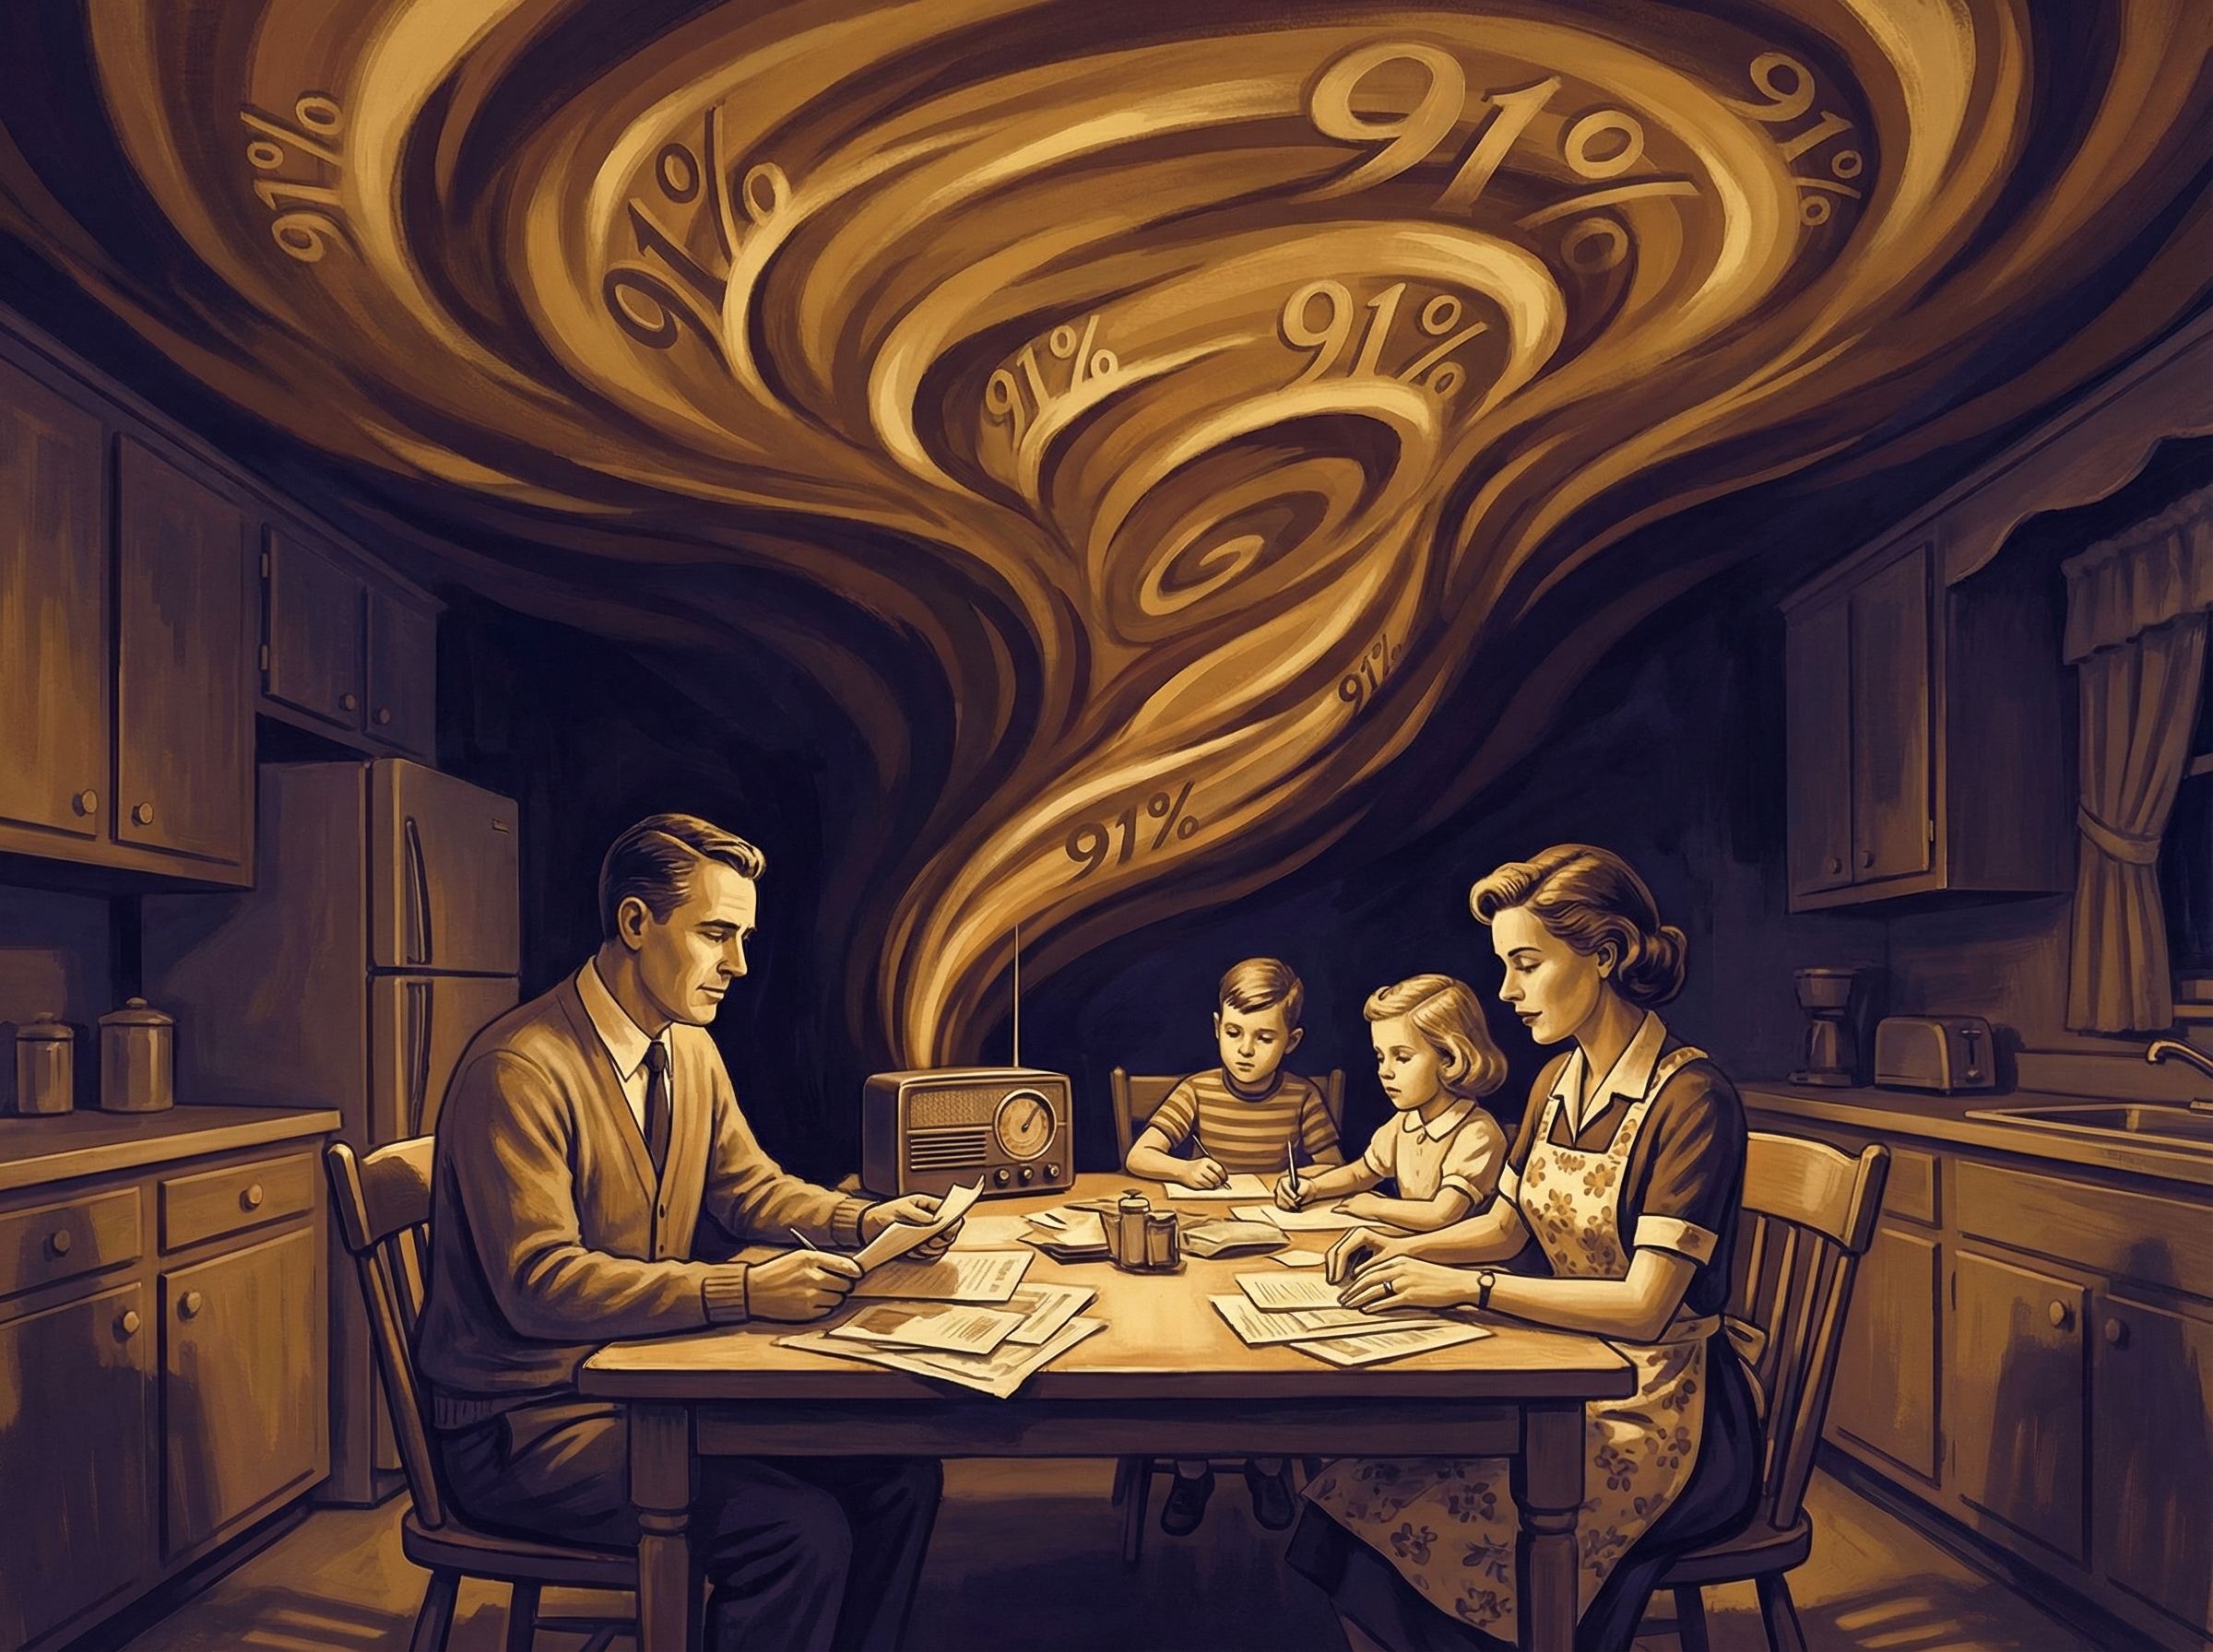
After V-J Day, that rate settled to 91% and stayed there for nearly two decades. Presidents Eisenhower, a Republican, governed comfortably under it. The interstate highway system, the GI Bill's education boom, the entire postwar American middle class — all built under a tax code that theoretically took nine cents on every dime earned above the top threshold.

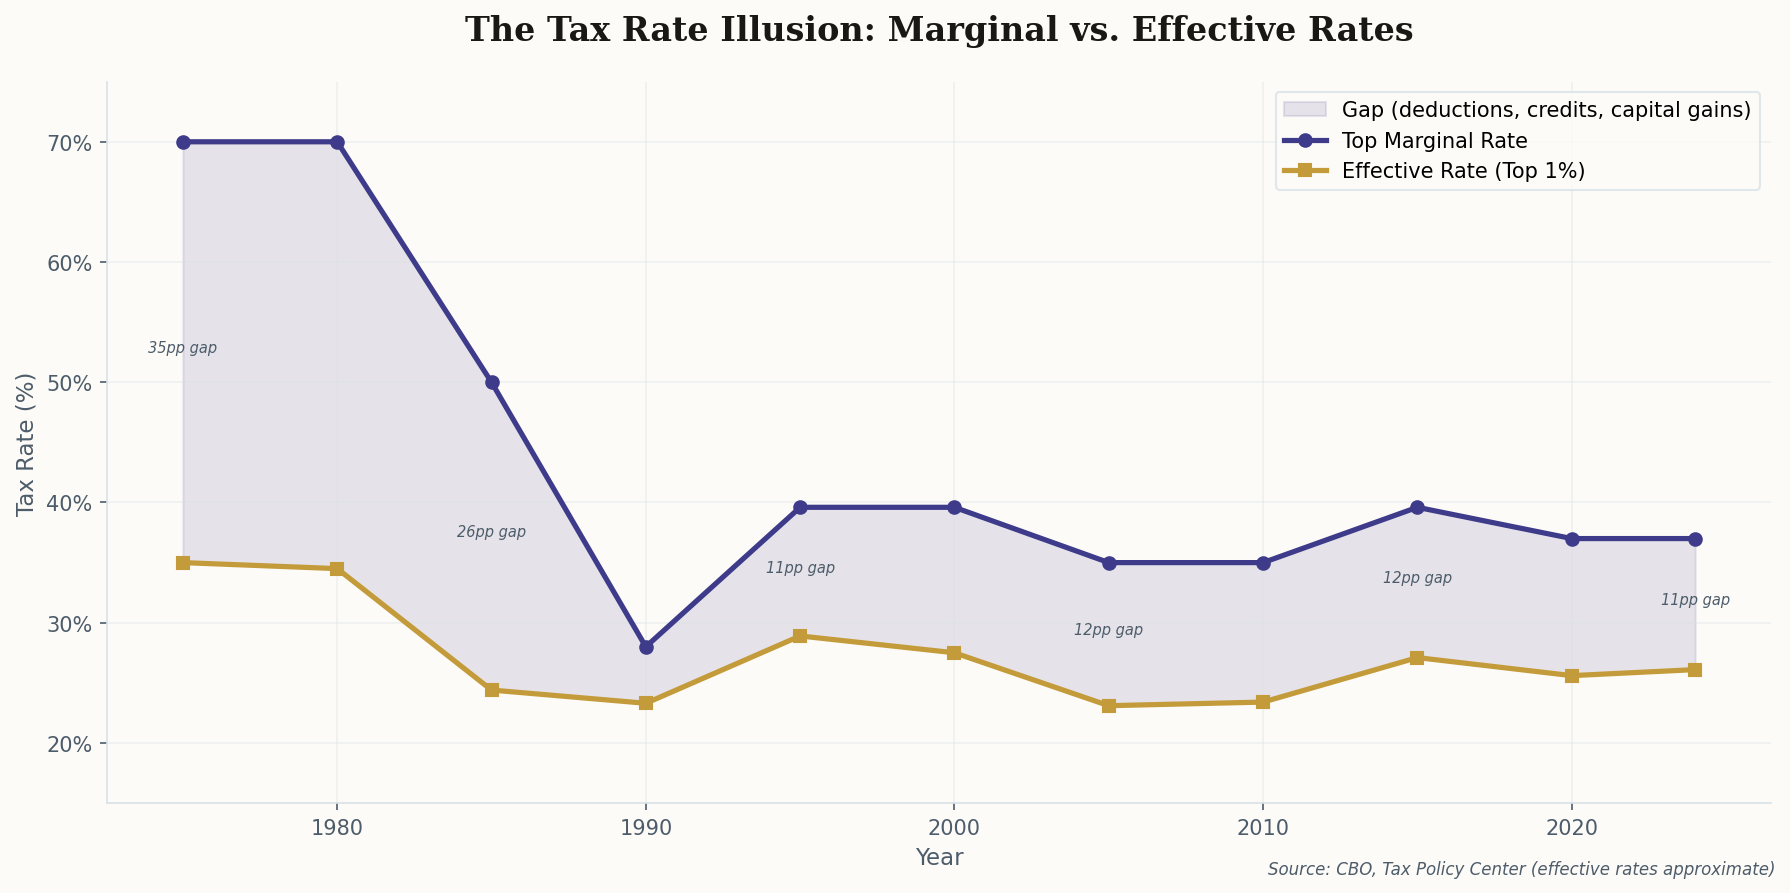
The operative word is "theoretically." Effective tax rates for the top 1% during this era were closer to 42% — still high by modern standards, but a far cry from 91%. The tax code was riddled with deductions, shelters, and loopholes that existed precisely because the statutory rates were so extreme. Municipal bonds, oil depletion allowances, real estate depreciation — the wealthy didn't pay 91%. They paid their accountants.

Chart showing the gap between top marginal tax rates and effective rates paid by the top 1%, 1975-2024
The persistent gap between what the code says and what the wealthy pay. Marginal rates gyrated from 70% to 28% and back, but effective rates for the top 1% stayed in a remarkably narrow 23–35% band.

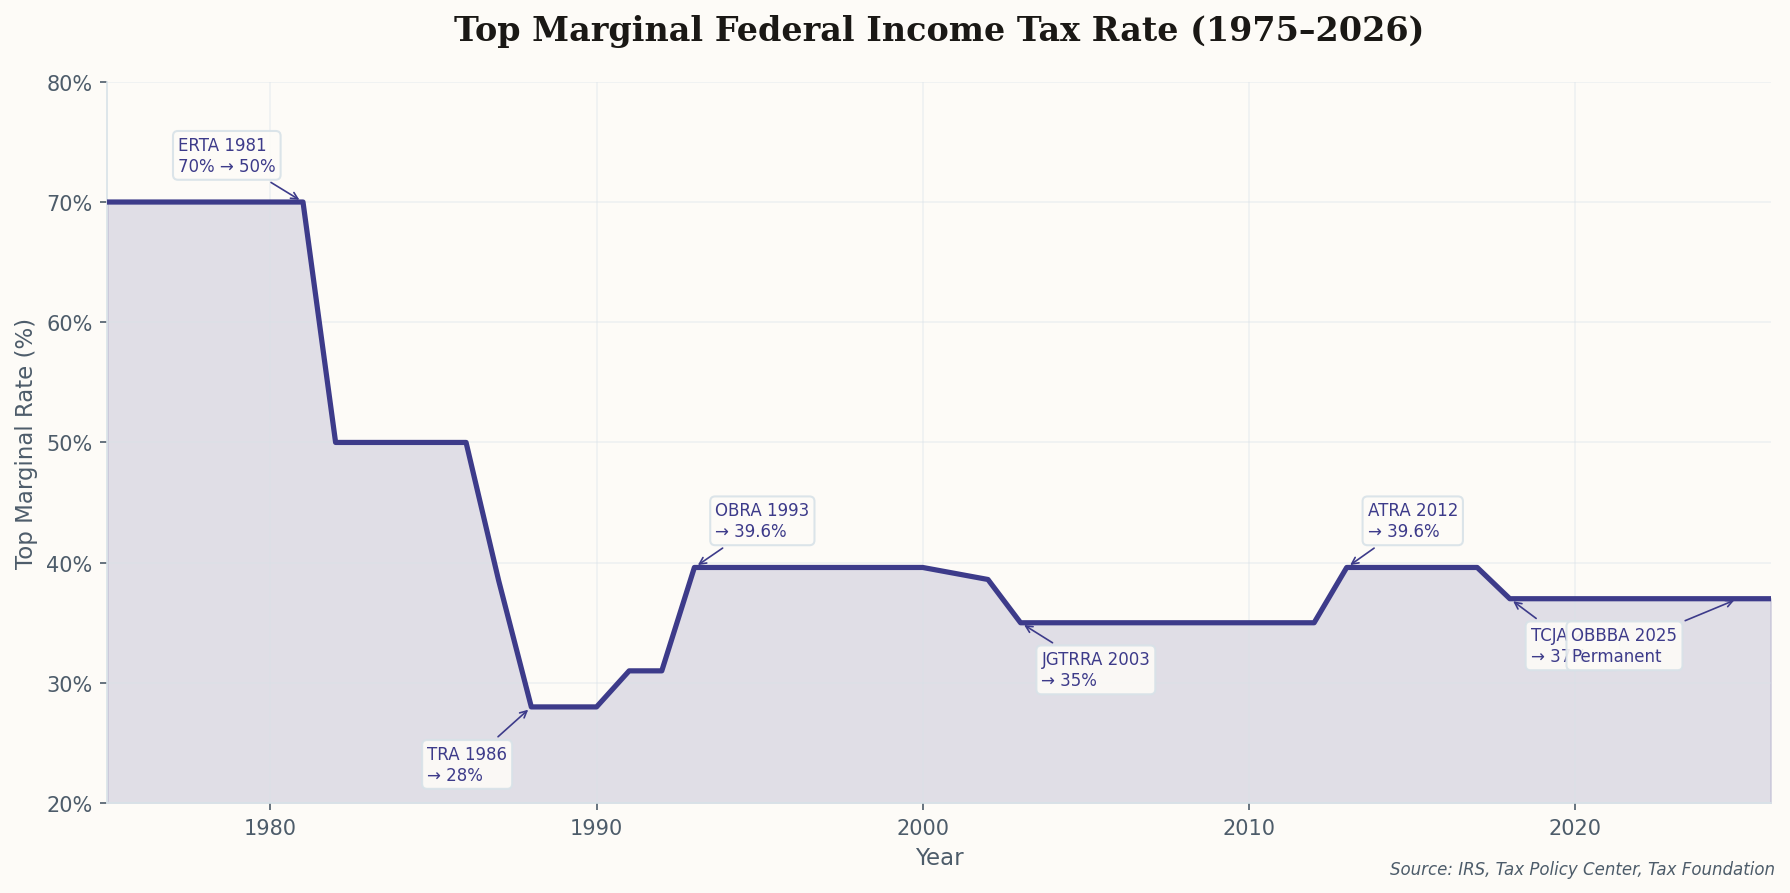
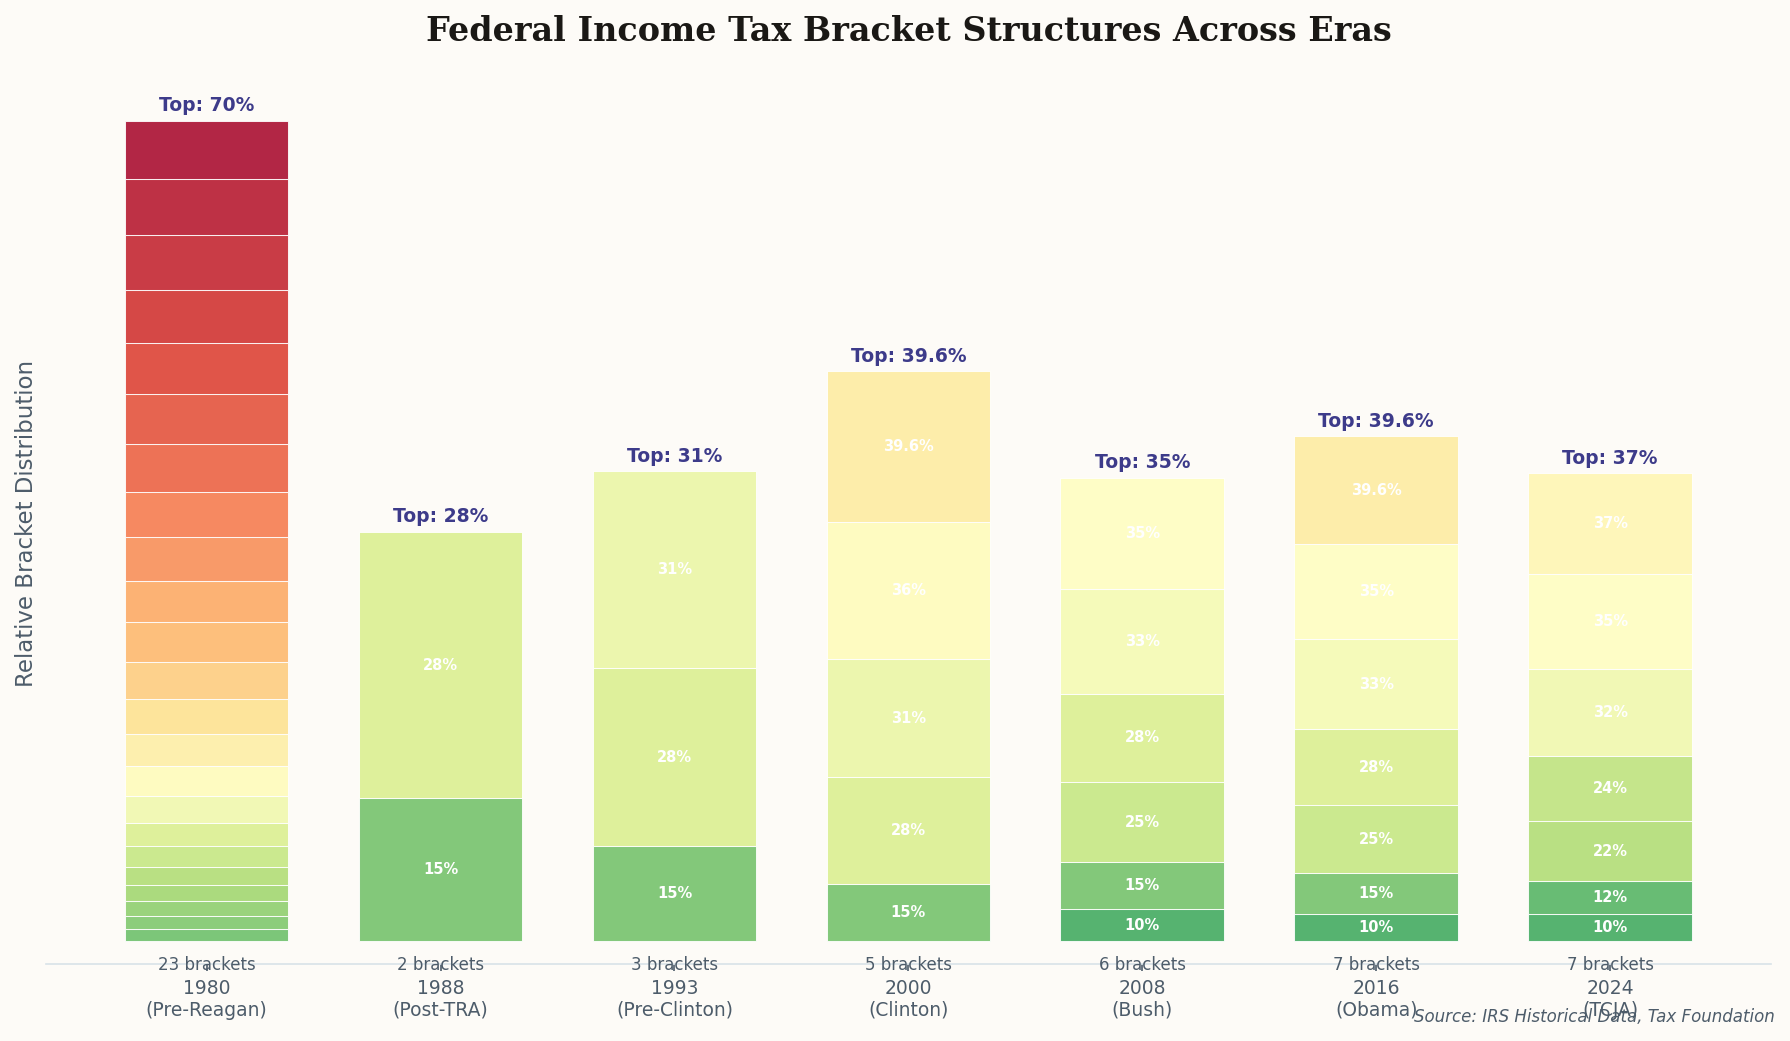
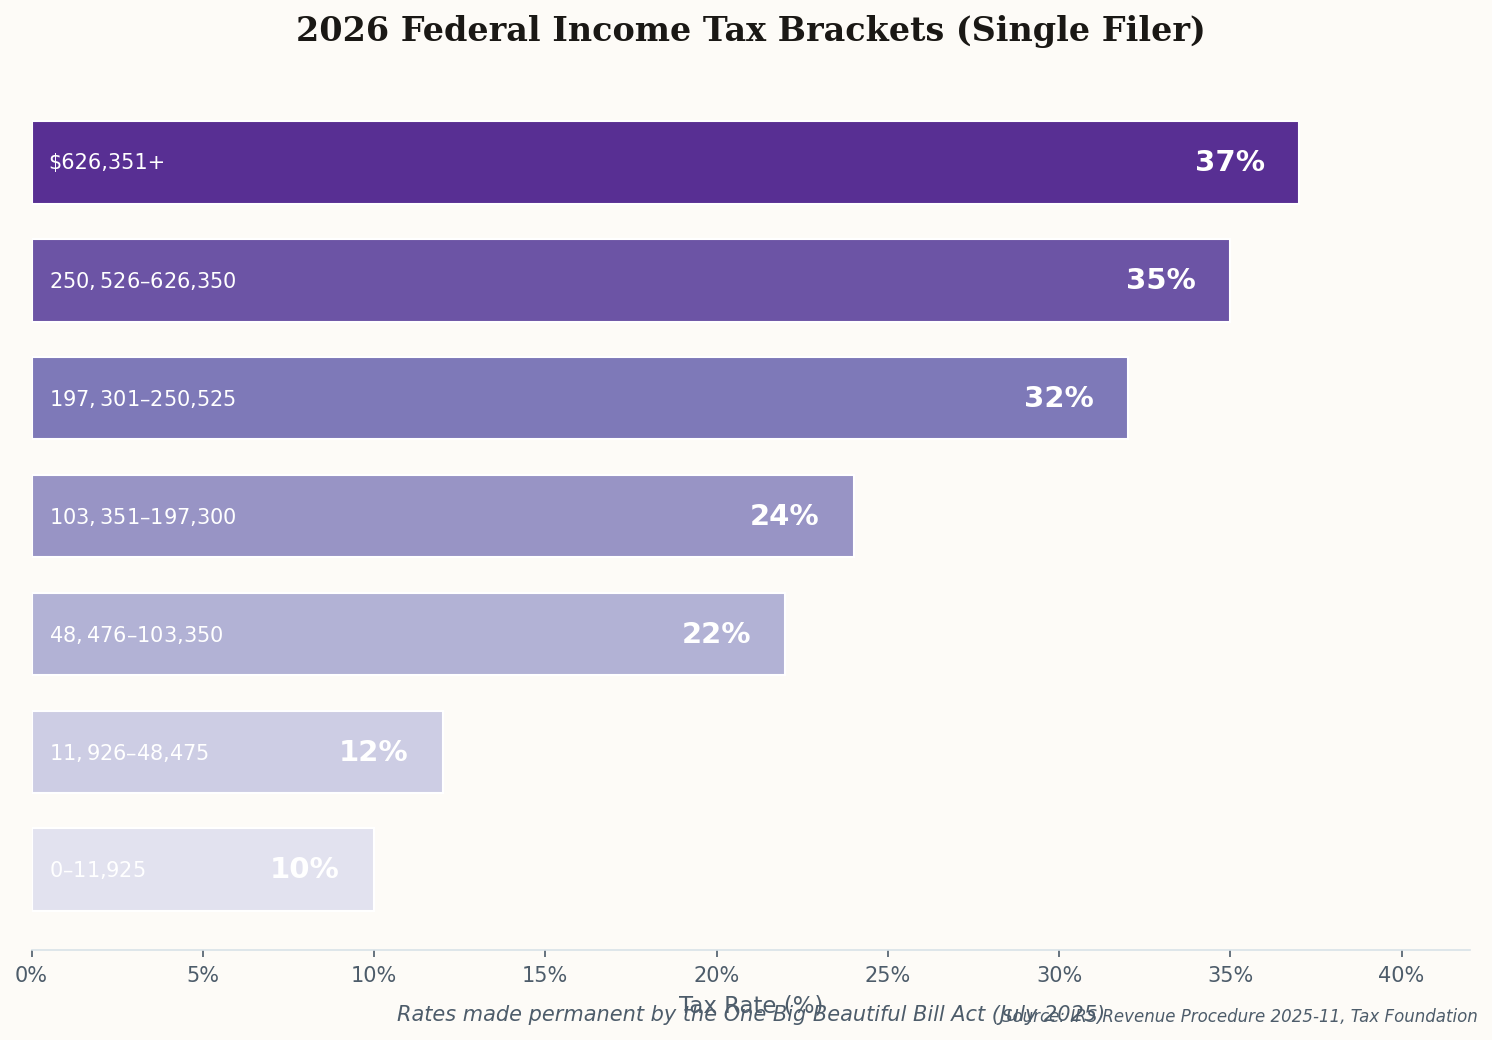
Then JFK proposed cutting the top rate to 65%. He was assassinated before it passed, but LBJ signed the Revenue Act of 1964, bringing the top rate to 70%. It was framed as a stimulus: lower the rates, broaden the base, grow the economy. Sound familiar? It should — this exact argument would recur in 1981, 2001, 2003, 2017, and 2025. The only thing that changes is the starting number.

Abstract visualization of tax rate pillars crumbling from 70% to 28%
02

Reagan Cuts the Code in Half — Twice

Ronald Reagan arrived in Washington with a simple conviction: the government was taking too much. The Economic Recovery Tax Act of 1981 (ERTA) slashed the top rate from 70% to 50% — the single largest marginal rate cut in modern history. It reduced rates across all brackets by 25% over three years and indexed brackets to inflation for the first time, ending the "bracket creep" that had been quietly raising everyone's taxes.

But Reagan wasn't done. The Tax Reform Act of 1986 was arguably the most radical restructuring of the tax code since its creation. It collapsed 15 brackets into just 2 — yes, two — with rates of 15% and 28%. The top marginal rate fell from 50% to 28%, the lowest since 1925. In exchange, the law eliminated many of the shelters and deductions that had made the old high rates bearable for the wealthy.

Timeline of top marginal federal income tax rate from 1975 to 2026, showing dramatic swings
Fifty years of the top marginal rate. The Reagan drop from 70% to 28% remains the most dramatic single shift. Note how the rate has oscillated between roughly 28–40% ever since.

The supply-side theory was elegant: lower rates, fewer loopholes, more honest compliance, broader growth. The practical results were messier. Federal revenue did decline as a share of GDP in the early 1980s, and the national debt tripled under Reagan — from $994 billion to $2.9 trillion. Defenders argue the spending side (Cold War defense buildup) was the real culprit. Critics point to the arithmetic: you can't cut rates by 60% and expect revenue to hold.

What's undeniable is the philosophical shift. Before Reagan, high marginal rates were the default, and cuts were the exception. After Reagan, the debate permanently moved: the question was no longer whether to keep rates below 40%, but exactly how far below.

Abstract visualization of budget surplus with balanced scales and rising green bars
03

The Last Time Washington Balanced the Books

George H.W. Bush made the most famous broken promise in tax history. "Read my lips: no new taxes," he declared at the 1988 Republican convention. Two years later, facing ballooning deficits, he signed the Omnibus Budget Reconciliation Act of 1990, which created a new 31% bracket. It cost him reelection. It also started closing the deficit.

Bill Clinton finished the job. The Omnibus Budget Reconciliation Act of 1993 passed without a single Republican vote and raised the top rate to 39.6%, added a 36% bracket, and lifted the Medicare tax cap. Republicans predicted catastrophe. Newt Gingrich called it "the largest tax increase in history." The economy proceeded to create 22.7 million jobs over the next eight years.

By fiscal year 1998, the federal budget was in surplus for the first time since 1969. It stayed there for four consecutive years, peaking at $236 billion in 2000. Federal revenue hit 20% of GDP — a level not seen since. The dot-com boom was the rocket fuel, but the Clinton tax increases provided the fiscal architecture that let surpluses accumulate rather than get spent on further tax cuts.

Dual chart showing federal revenue and budget balance as percentage of GDP, 1975-2024
Federal revenue stays in a remarkably tight band (15–20% of GDP) regardless of rate changes — but the budget balance swings wildly. The Clinton surpluses remain the only period of sustained black ink in the last 50 years.

The lesson that nobody learned: the surplus came from both higher rates and a booming economy. Supply-siders claimed the economy succeeded despite the tax hikes. Progressives claimed it succeeded because of them. The truth, as usual, was more boring — growth generates revenue, and fiscal discipline requires spending restraint and adequate taxation simultaneously. Washington chose to forget this the moment the surplus appeared.

A gleaming tower of tax cuts built on an increasingly precarious foundation of debt
04

How to Spend a Surplus Before It Arrives

George W. Bush inherited a projected $5.6 trillion surplus over the next decade. He left office with a $10 trillion national debt. The tax cuts were only part of the story — 9/11, two wars, Medicare Part D, and the 2008 financial crisis all contributed — but the EGTRRA (2001) and JGTRRA (2003) were the foundational fiscal choice.

The Bush cuts introduced the 10% bracket (a genuine win for low-income filers), cut the top rate from 39.6% to 35%, reduced capital gains rates to 15%, and slashed dividend taxes. The total cost: an estimated $1.35 trillion over ten years for EGTRRA alone. To comply with budget reconciliation rules, every provision carried a sunset date — they were all scheduled to expire after December 31, 2010. This "temporary" framing was pure political theater; everyone understood the goal was permanence.

The economic case was straightforward: the surplus was "the people's money" and should be returned. But the timing was catastrophic. By late 2001, the economy was in recession, and the surpluses evaporated. What replaced them was a decade of structural deficits — not from emergency spending, but from a tax code that couldn't generate enough revenue to cover normal government operations plus two wars.

Comparison of tax bracket structures across seven eras, showing how the number and distribution of brackets changed dramatically
The evolution of bracket complexity: from 23 brackets in 1980 to just 2 under Reagan's 1986 reform, then back up to 7 under Bush and beyond. More brackets doesn't necessarily mean more progressive — it means more political levers to pull.

The enduring legacy of the Bush era isn't the rates themselves — they were modest adjustments compared to Reagan's revolution. It's the precedent: tax cuts don't need to be paid for. The "starve the beast" theory held that cutting revenue would force spending cuts. Instead, it proved that Congress will simply borrow. As Vice President Cheney reportedly told Treasury Secretary Paul O'Neill: "Reagan proved that deficits don't matter." They do. It just takes a while.

Dramatic cliff edge with a narrow bridge being hastily constructed, healthcare symbols woven into the structure
05

The Cliff, the Deal, and the Hidden Tax

The Bush tax cuts were supposed to expire at the end of 2010. Then Obama extended them for two years. Then they were supposed to expire at the end of 2012. This was the "fiscal cliff" — a simultaneous expiration of tax cuts and activation of spending cuts that would have sucked roughly $600 billion out of the economy overnight.

The resolution came via the American Taxpayer Relief Act of 2012 (ATRA), signed on January 2, 2013, after the cliff had technically arrived. The deal made the Bush rates permanent for everyone except the highest earners: the top rate returned to 39.6% for individuals earning above $400,000 (couples above $450,000). Capital gains went back to 20% for those same high earners.

But the bigger story was the tax nobody talks about. The Affordable Care Act of 2010 had quietly introduced a 3.8% Net Investment Income Tax (NIIT) on investment income above $200,000/$250,000. Combined with the restored 39.6% top rate, the effective marginal rate on high-income investment income hit 43.4% — higher than at any point since 1986.

The Obama-era tax code was a compromise machine: lower rates for 99% of Americans, higher rates for the top 1%, and a new surtax funding healthcare expansion. Federal revenue recovered to 17.6% of GDP by 2016 — not Clinton-era levels, but enough to narrow (not close) the deficit. The framework held for just four years before the next revolution.

Bold geometric visualization of corporate tax transformation, 35 morphing into 21
06

The Corporate Rate Gets Cut in Half

The Tax Cuts and Jobs Act of 2017 was the most significant tax overhaul since Reagan's 1986 reform — but its center of gravity was entirely different. Where Reagan focused on individual rates, the TCJA's headline move was slashing the corporate rate from 35% to 21%, a permanent change that made the U.S. corporate tax rate competitive with OECD averages for the first time in decades.

On the individual side, the TCJA reduced rates across nearly every bracket: the top rate fell from 39.6% to 37%, the 33% bracket became 32%, the 28% became 24%, and the 25% became 22%. The standard deduction roughly doubled to $12,000/$24,000, effectively removing millions of filers from itemizing. The tradeoff: personal exemptions were eliminated, and the SALT deduction was capped at $10,000.

That SALT cap was a political grenade. High-tax states like New York, New Jersey, and California saw their residents lose deductions worth $20,000–$50,000 or more. It was, functionally, a tax increase on upper-middle-class homeowners in blue states — a point not lost on anyone. The SALT cap became the most politically charged provision in the entire law.

The TCJA's other major innovation was the 20% deduction for qualified business income (Section 199A), giving pass-through businesses — partnerships, S-corps, sole proprietors — a significant new benefit. The CBO estimated the total cost at $1.5 trillion over ten years. And here was the familiar trick: individual provisions were set to sunset after 2025. The corporate rate cut was permanent from day one.

Modern editorial illustration of legislative permanence with a massive document being sealed, fireworks suggesting July 4th signing
07

The One Big Beautiful Bill Makes It Permanent

For years, tax professionals, financial planners, and anxious Americans asked the same question: what happens when the TCJA expires? On July 4, 2025, they got their answer. The One Big Beautiful Bill Act (Public Law 119-21) made the TCJA's individual rates permanent, ending eight years of uncertainty with a stroke of a pen and a fireworks display.

The seven brackets — 10%, 12%, 22%, 24%, 32%, 35%, and 37% — are now the law indefinitely, indexed for inflation. The doubled standard deduction stays. The QBI deduction stays. And the SALT cap? It jumps from $10,000 to $40,000, but with a critical income phaseout: the higher cap begins shrinking at $500,000 and disappears entirely above $600,000. In 2030, it reverts to $10,000 permanently.

Horizontal bar chart showing 2026 federal income tax brackets for single filers, from 10% to 37%
The 2026 tax brackets as permanently established by the One Big Beautiful Bill Act. These rates, first introduced by the 2017 TCJA, are now the law of the land — inflation-indexed and with no sunset.

The bill also introduced new temporary provisions: no tax on overtime pay (capped at $12,500 for single filers, through 2028), an additional $6,000 deduction for seniors 65+, and the restoration of 100% bonus depreciation for qualified property through 2029. The Tax Foundation estimates the OBBBA adds roughly $3.3 trillion to the deficit over the next decade — though proponents argue the economic growth it sustains will offset a significant portion.

What does permanence actually mean? For the 90% of filers who take the standard deduction, not much changes day to day — these have been their rates since 2018. For financial planners and estate attorneys, it means the end of a planning nightmare: they no longer have to model two parallel tax universes. For the national debt, which now exceeds $36 trillion, it means the revenue side of the ledger is locked in, and the only remaining fiscal lever is spending. Good luck with that.

The Only Constant Is the Argument

In fifty years, the top marginal rate fell from 70% to 28%, rose to 39.6%, dropped to 35%, returned to 39.6%, fell to 37%, and was made permanent at 37%. Federal revenue, meanwhile, hovered stubbornly between 15–20% of GDP regardless. The tax code isn't a science experiment — it's a story about values, and every generation rewrites it. The 2025 settlement may feel permanent today. Give it a decade.