Demographics & Forecasting

The Country That's Slowly Disappearing

By 2038, America will produce more coffins than cribs. What happens to a superpower when its population math stops working?

Listen
Aerial visualization of American cityscape transforming from 1990s suburban sprawl to 2055 dense, diverse urban neighborhood
Abstract bridge structure slowly descending into mist, representing population growth curve flattening
01

2038: The Year America Starts Shrinking From the Inside

Here's a number that should keep policy makers up at night: 2038. That's when the Census Bureau projects that deaths in America will exceed births for the first time in the nation's history. Not in some distant, sci-fi future. Twelve years from now.

From that point forward, every single person added to the U.S. population will be an immigrant. Not most people. Not the majority. Every single one. The organic growth engine that powered American expansion for 250 years — native-born citizens having more children than the generation before — will have switched off permanently.

Three population projection scenarios showing main series, high immigration, and zero immigration paths through 2100
Under the Census Bureau's "Zero Immigration" scenario, the U.S. population would have begun declining in 2024 and shrink to 226 million by 2100 — a loss of 107 million people from current levels.

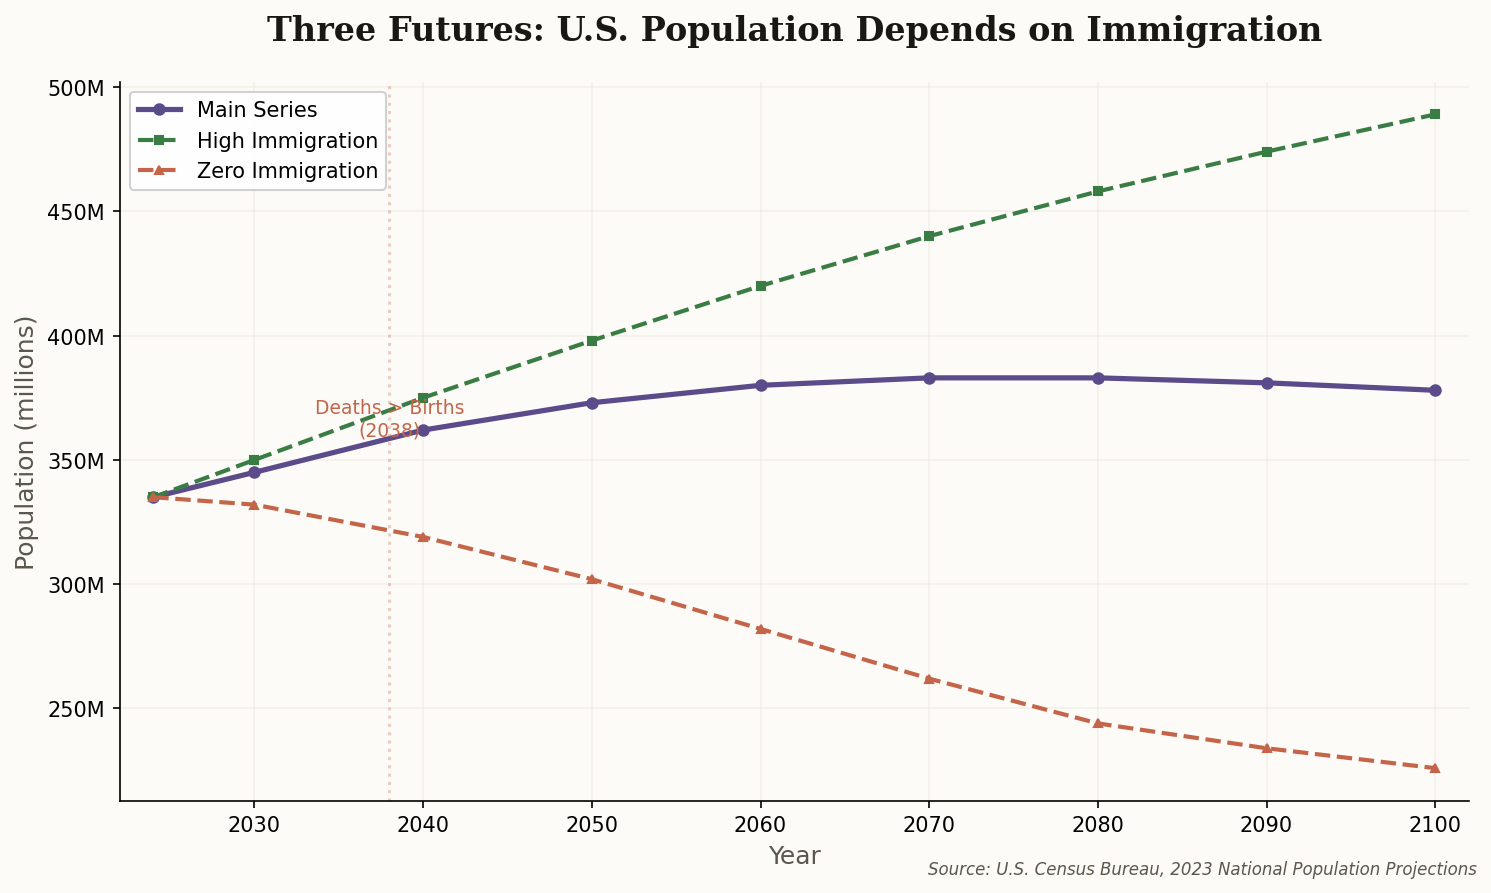
The math is blunt. Under the main series projection, annual growth drops to a threadbare 0.13% by century's end. But consider the alternative scenarios: with high immigration, America reaches 489 million by 2100. With zero immigration, it contracts to 226 million — a difference of 263 million people determined entirely by policy choices, not biology.

As Census demographer Sandra Johnson put it: "In an ever-changing world, understanding population dynamics is crucial for shaping policies and planning resources." That's bureaucrat-speak for: the decisions we make about immigration in the next decade will determine whether America in 2060 has the economic heft of a superpower or the demographic profile of Japan.

Mosaic portrait of America composed of diverse faces, tiles transitioning to new colors
02

The End of "Majority America" — And Why the Categories Themselves Are Breaking

By 2045, non-Hispanic White Americans will drop below 50% of the population for the first time. But here's the part that makes demographers nervous about even reporting this: the categories we use to describe it are increasingly meaningless.

The fastest-growing racial group in America isn't Hispanic or Asian — it's "Two or More Races," projected to more than double in the coming decades. The Hispanic population will clear 25% of the total by 2060. The Asian-American population is the fastest-growing single-race group in percentage terms. And all of these groups are intermarrying at historically unprecedented rates.

Stacked bar chart showing racial composition shifting from 2020 to 2055, with the non-Hispanic White share crossing below 50% in 2045
The "majority-minority" crossover projected for 2045. By 2055, no single racial group will represent a majority — the U.S. becomes a nation of minorities.

What does "majority-minority" actually mean when a growing share of the population checks multiple boxes — or none at all? The Census Bureau itself has acknowledged that its racial categories, designed in the 1970s, are increasingly poor containers for a blending nation. The 2030 Census will likely feature revised categories that could scramble these projections entirely.

The practical implication: every institution built around a "mainstream" American consumer, voter, or student is operating on a model that won't exist in 20 years. The companies and political parties that figure this out first will dominate the next era. The ones that don't will spend the 2040s wondering what happened.

Split aerial view contrasting thriving Sunbelt city with quiet declining Midwest town
03

Two Americas, One Map: The Sunbelt Swallows the Rust Belt

The United States isn't just changing in composition — it's physically migrating. The South and West will absorb 6–8% more population by 2030 alone. Texas is projected to grow 23.5% by 2050. Florida, 19.8%. Arizona, 18.2%. Meanwhile, the Midwest starts losing people in absolute terms between 2030 and 2040, and the Northeast follows a decade later.

Horizontal bar chart showing projected population changes by state through 2050, with Sunbelt states growing and Rust Belt states declining
Projected population change by 2050. Texas leads growth (+23.5%), while West Virginia faces the steepest decline (-12.3%). The divide is accelerating.

West Virginia's projected 12.3% decline is the canary in the coal mine — literally. But the phenomenon extends well beyond Appalachia. Illinois, Pennsylvania, Ohio, and New York are all projected to shrink. These aren't just numbers on a page; they're school closures, abandoned infrastructure, declining tax bases, and the slow hollowing-out of communities that once defined the American middle class.

The downstream effects ripple through politics. The 2030 Census reapportionment will almost certainly shift more House seats and Electoral College votes to Texas, Florida, and the Carolinas. The political gravity of America is heading south and west, and the infrastructure, housing, and water resources in those regions aren't remotely ready for what's coming.

Silver-haired figures walking through luminous corridor with medical monitoring displays floating like halos
04

82 Million Americans Over 65 by 2050 — And Nobody Knows Who Will Take Care of Them

This is the single most expensive demographic fact in America: by 2050, 82 million people will be 65 or older — up from 58 million in 2022, a 42% increase. Nearly one in four Americans will be a senior citizen. And the "oldest old" — those 85 and above — will more than double, from 6.5 million to 13.7 million by 2040.

Stacked area chart showing the working-age share of the population shrinking from 62% to 58% between 2020 and 2055
The dependency squeeze: the working-age population (18–64) shrinks from 61.5% to under 58% of the total, while the 65+ share climbs from 16.5% to 23%.

The math here is ruthless. Every senior citizen requires some combination of healthcare, housing support, and eventually direct care. The current healthcare workforce is already short by tens of thousands of physicians. Home health aides — the frontline workers who keep aging Americans out of institutions — are among the lowest-paid workers in the economy, and the field has chronic vacancies.

Medicare's Hospital Insurance Trust Fund is projected to be insolvent by the early 2030s. Social Security faces a similar crunch by 2035. These aren't partisan talking points — they're actuarial certainties baked into the age structure of the population. The only variables are whether we address them with revenue increases, benefit cuts, or some combination. But the demographic pressure is locked in. The boomers are already here, and they're not getting younger.

Empty office chairs receding into distance, some occupied, with robot arm working at one desk in dawn light
05

The Workforce Is Shrinking — And AI Isn't a Choice Anymore, It's a Necessity

The CBO's 2024 demographic outlook contains a number that should reframe every debate about automation: prime-age workforce growth (ages 25–54) has decelerated to 0.2% per year. Without net immigration, the U.S. labor force would already be contracting.

By 2035, the last Baby Boomers will have exited the prime workforce, taking 15.6 million experienced workers with them, according to the Joint Center for Housing Studies. These aren't interchangeable cogs — they're skilled tradespeople, medical professionals, engineers, and managers whose institutional knowledge can't be downloaded.

This changes the AI conversation fundamentally. The question isn't whether automation will "take jobs" — it's whether automation can scale fast enough to fill the jobs that demographics are already taking away. Warehouses, hospitals, farms, construction sites — these all need bodies, and the bodies aren't being born in sufficient numbers. The countries and companies that deploy AI and robotics most effectively won't be the ones chasing efficiency gains. They'll be the ones avoiding economic contraction.

Japan — where the working-age population has been shrinking since the mid-1990s — is the preview. Three decades of labor force decline gave it three decades of near-zero GDP growth. America has about a decade to decide whether it follows that path or finds an alternative.

Suburban house mid-transformation from traditional colonial to accessible modern design with construction scaffolding
06

Your Suburb Was Built for Families. Its Future Tenants Will Be 80.

By 2035, one in three American households will be headed by someone 65 or older — 49.6 million households. The 80+ household count alone will surge by 5.5 million in a single decade. Meanwhile, households headed by someone under 35 will actually decline by 500,000.

Read that again: more new households run by octogenarians than by young adults. The housing market implications are staggering.

America's existing housing stock was overwhelmingly built for nuclear families with children: multi-story homes with stairs, garages at the end of driveways, bedrooms on second floors. As Harvard's housing researchers bluntly note: "The U.S. is not prepared to meet the housing needs of an aging population... most homes lack accessibility features." The AARP estimates that fewer than 4% of American homes have basic aging-in-place features like zero-step entries, wide doorways, and first-floor bedrooms.

The starter-home market may actually soften — not because housing costs decrease, but because there simply won't be enough young households forming to fill them. The real demand will be in accessible, single-level homes and assisted-living facilities. Developers who are still building three-story townhomes in 2030 will find themselves retrofitting them for wheelchair ramps by 2040. The suburbs designed around school districts and playground proximity will need to reinvent themselves around medical offices and accessible transit — or face the kind of slow economic decline already visible in aging European and Japanese suburbs.

The Math Doesn't Care About Your Politics

Every projection in this newsletter shares a common trait: none of them require you to believe a particular political narrative. The age structure is locked in — the people who will be 65 in 2055 are already alive today. The fertility decline is a global phenomenon, not an American policy failure. The geographic migration is driven by economics and climate, not ideology. The only truly controllable variable is immigration — and on that question, the gap between "high" and "zero" scenarios is 263 million people by 2100. That's the entire current population of Indonesia. Whatever your politics, the arithmetic demands engagement. The country that emerges in 2055 will be older, more diverse, more southern, and more dependent on the choices made in the next decade than at any point in its history. The demographic clock is ticking. The question isn't whether America will change — it's whether it will be ready.