Presentation Science

The Quantified Story

How neuroscience, AI tools, and business metrics are finally answering the question: "Did my presentation actually work?"

Listen
Neural pathways forming narrative structures in a translucent brain visualization
01

Your Brain Has a "Story Mode"—And Scientists Just Found Where It Lives

Cerebellum visualization with rhythmic neural activity patterns

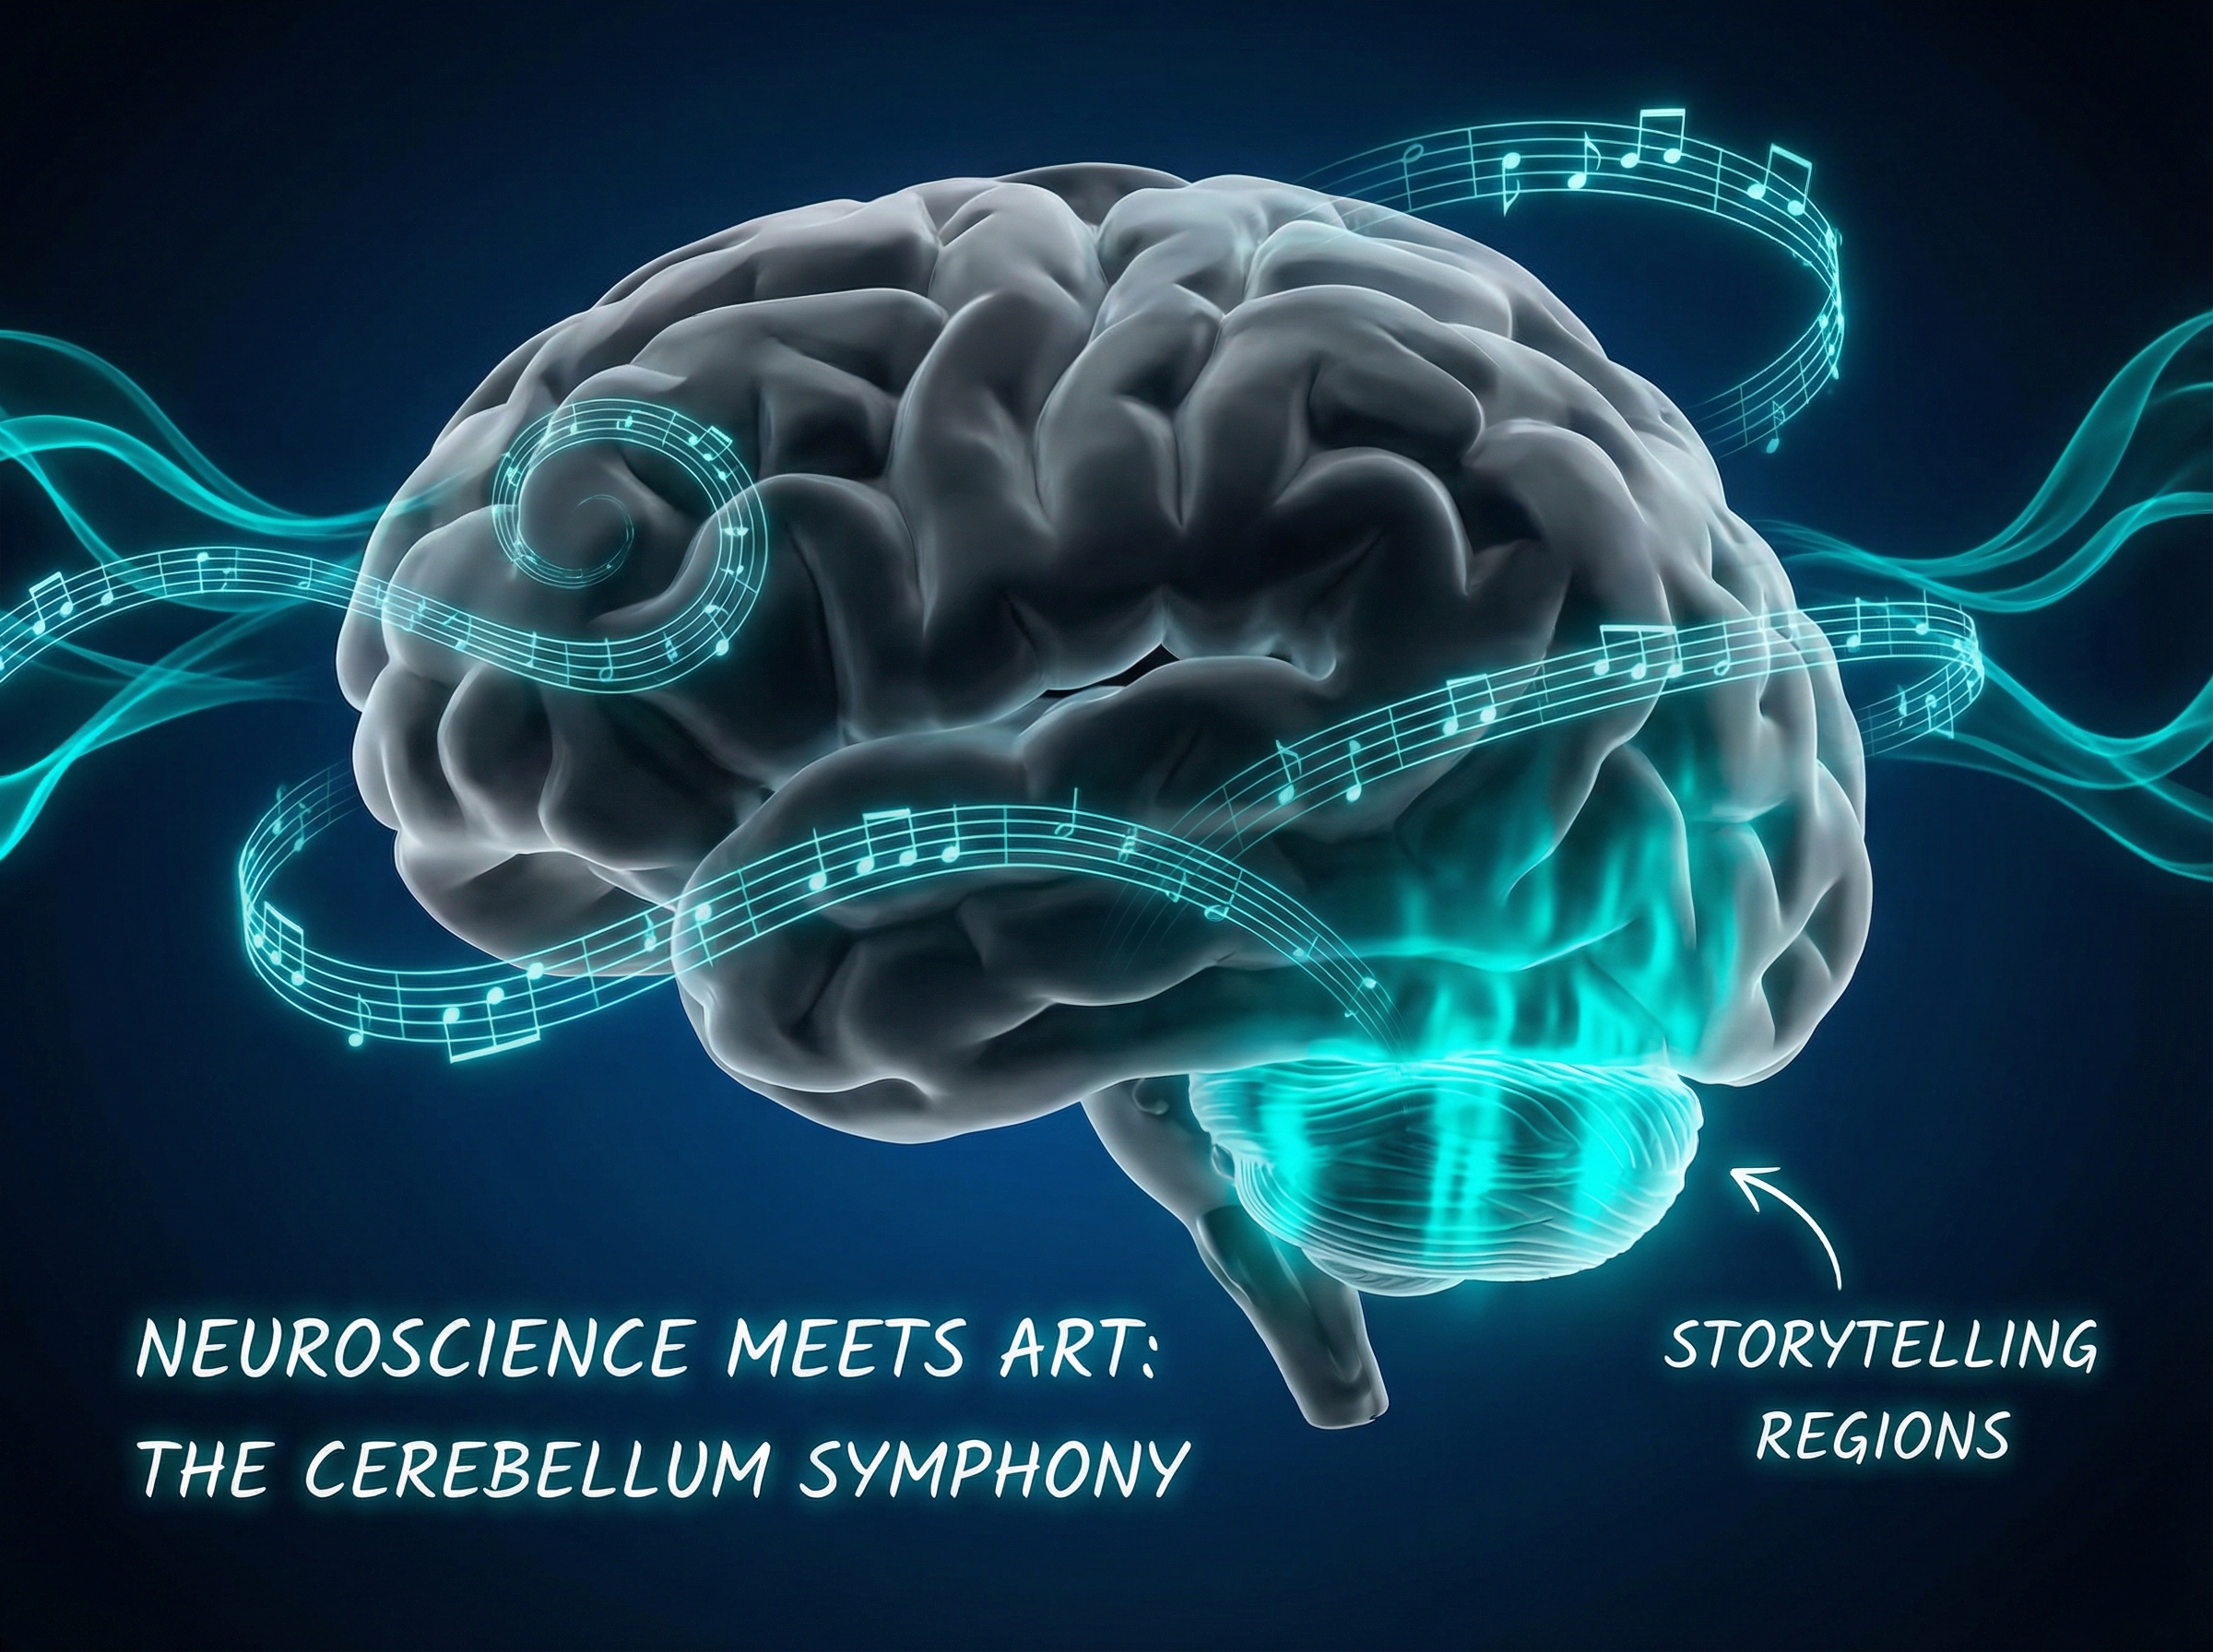
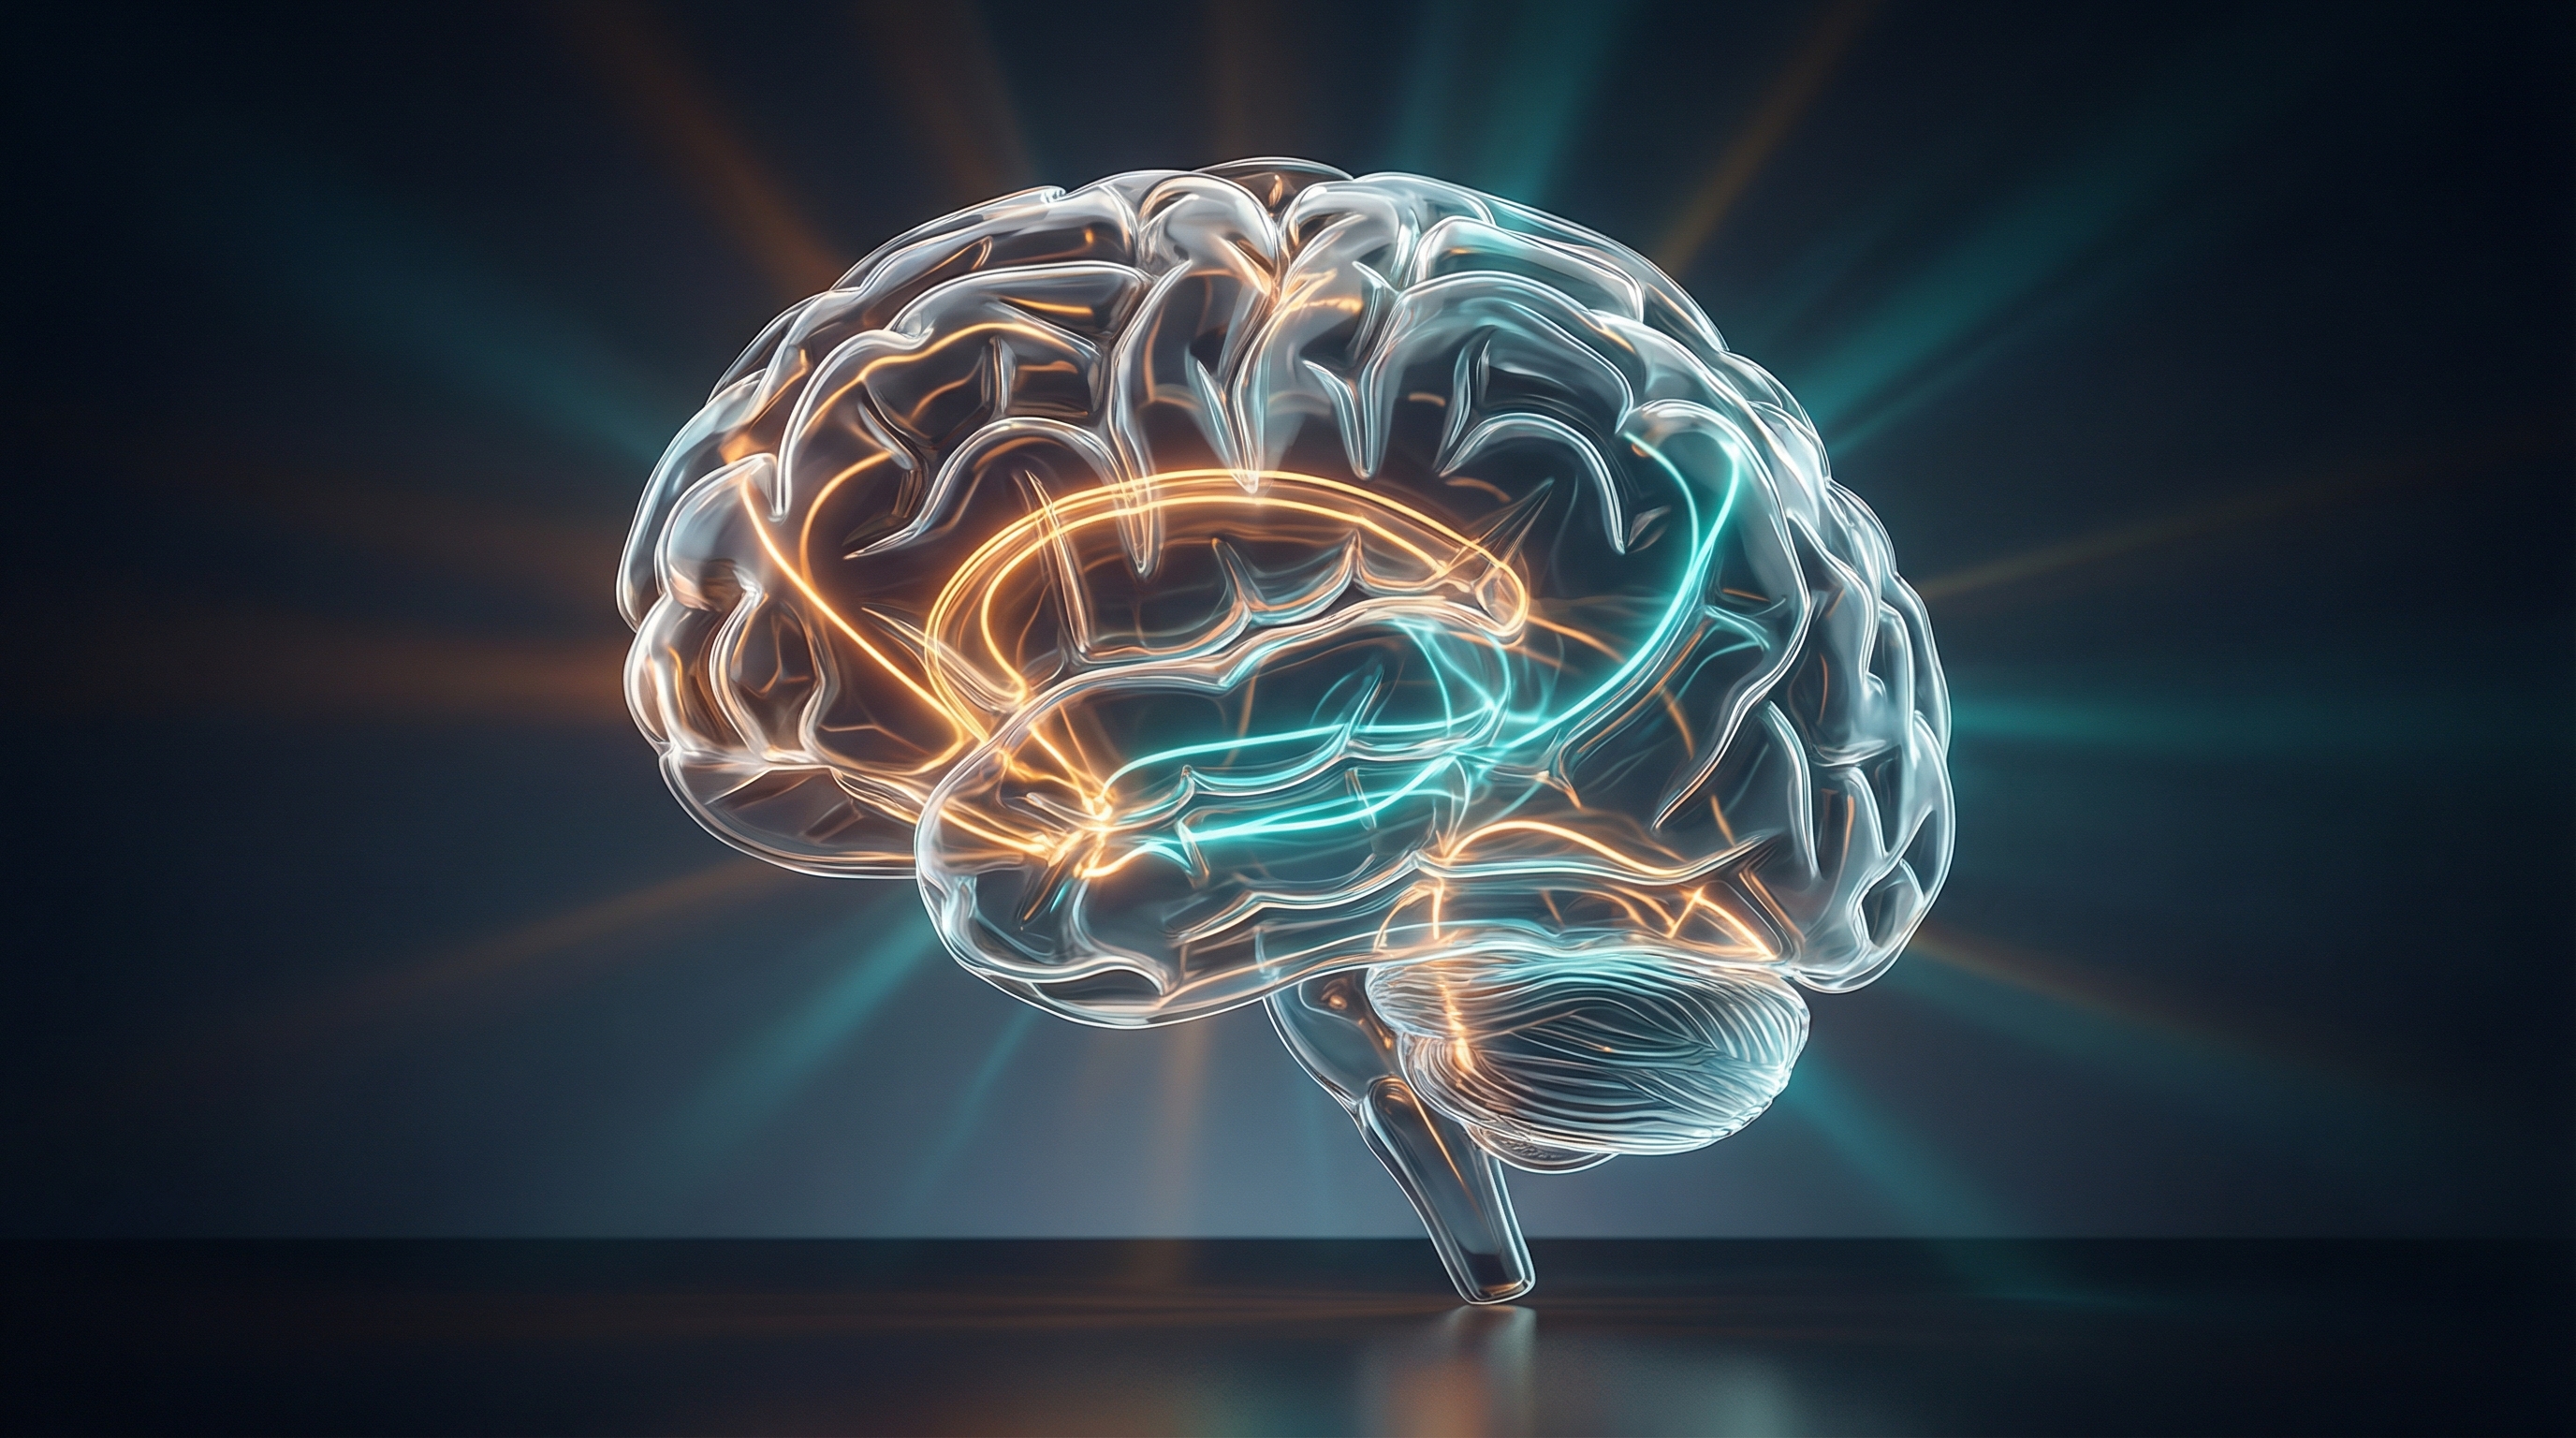
Here's a finding that should change how every presenter thinks about their craft: researchers have identified a specific region in the cerebellum that activates selectively during high-engagement storytelling. When presenters shift from factual recitation to narrative delivery—introducing conflict, stakes, resolution—this region lights up like a switchboard. During dry data dumps? Dormant.

The researchers describe it as the brain's "rhythm of narrative thought." The cerebellum, long understood as the motor coordination center, turns out to orchestrate our engagement with stories much like it coordinates physical movement. There's a tempo to effective narrative, and the brain literally dances to it.

What this means for practitioners: "storytelling" isn't a soft skill you can dismiss as touchy-feely executive coaching nonsense. It's a distinct cognitive activator with measurable neural signatures. When your CFO questions why the sales team needs narrative training, you now have a biological answer.

02

Memory Sculpting: Why HOW You Tell It Matters More Than WHAT You Tell

Abstract memory architecture with sensory and reflective pathways

A Journal of Neuroscience study from October proves something presentation designers have suspected but couldn't demonstrate: the structure of a story activates distinct neural networks, effectively "sculpting" how memories are encoded. Sensory-heavy narratives (rich with visual and tactile detail) and reflective narratives (emphasizing meaning and implication) create different memory architectures.

Chart showing narrative structure dramatically improves memory retention
Sensory-heavy narratives achieve 68% 7-day recall vs. 22% for facts-only presentations

The critical finding: narrative delivery style was more predictive of recall accuracy than the content itself. Read that again. The container shapes the content. As the researchers put it: "You can effectively 'program' recall by selecting specific structural archetypes."

This has immediate implications for how you choose narrative frameworks. Need your audience to remember specific details three months later? Front-load sensory anchors. Need them to internalize strategic implications? Build a reflective arc. The Hero's Journey and the Mountain aren't just storytelling traditions—they're memory engineering tools, and we now have data on which tool does what.

03

Prezent's "Communication Fingerprint" Predicts Audience Response Before You Present

Digital fingerprint formed from communication pattern waveforms

The shift from post-hoc feedback to predictive optimization is here. Prezent now uses AI to analyze an organization's communication patterns and generate a unique "Communication Fingerprint" for each presenter and audience archetype. Their system maps individual styles—are you data-driven or emotional? Do you lead with conclusions or build up?—against audience preferences.

The result: a "content-to-audience fit score" before you ever step into the room. It's hyper-personalized communication intelligence that predicts acceptance rates based on who's listening, not just what you're saying.

Chart comparing AI presentation tool capabilities
Prezent leads in predictive analysis (9/10) and audience matching (9/10) among AI presentation tools

This matters because we've historically measured presentation success by what happened after—did we close the deal, did the board approve the budget, did the audience remember anything a week later? Now we can adjust before, matching narrative style to the specific decision-makers in the room. The era of one-size-fits-all presentation coaching is ending.

04

Gamma and Beautiful.ai Now Show Exactly Where You Lost the Room

Dashboard showing sentiment heatmaps and attention curves

The latest AI features from Gamma and Beautiful.ai track viewer drop-off at the slide-by-slide level. For shared decks, you get "Sentiment Heatmaps" that infer audience reaction based on dwell time and interaction rates. It's analytics that show exactly where you lost attention—down to the second.

Decktopus is taking a different approach: an AI coach that critiques delivery tone to match the narrative arc. Too monotone during the climax? It flags it. Energy dropping during your key ask? You'll know.

These tools democratize what used to require expensive presentation consultants or focus group testing. Anyone building a pitch deck can now see which of their 15 slides consistently loses people—and it's usually not the one they expected. (Hint: it's almost always the "market size" slide where you thought the big numbers would impress.)

05

Story Retention Rate: The Metric That Finally Gives Narrative a Financial Argument

ROI visualization connecting narrative threads to business metrics

The corporate storytelling ROI model from Marketing LTB finally gives internal comms teams the financial language they need. Instead of fuzzy "brand awareness" metrics, they're tracking Conversion Correlation and Customer Lifetime Value. Most importantly, they've introduced "Story Retention Rate"—how much of your narrative is recalled 2 weeks later—as a leading indicator of business outcomes.

Chart showing narrative-driven presentations outperform on key business metrics
Narrative-driven presentations show 300% improvement in engagement and 85% faster decision velocity

The numbers: clearer data presentation through storytelling leads to a 300% boost in audience engagement and measurably faster executive consensus. The second finding is what should get budget-holders' attention. Narrative clarity reduces "Time to Consensus"—meaning meetings are shorter and decisions happen faster. That's not about being entertaining; it's about reducing the cost of decision-making itself.

When you can show that better storytelling shortens your sales cycle or reduces the number of board meetings needed to approve a strategy, suddenly the training budget makes sense.

06

Duarte's 2026 Framework Shifts from "Clarity" to "Adoption"

Executive presenting with empathy map overlay showing audience psychology

Duarte remains the gold standard in presentation methodology, and their 2026 Skills Roadmap for Data Storytelling signals an important evolution. The structured competency model moves beyond slide design to assess Executive Presence and Empathy Mapping—how well you read the room and adjust in real-time.

Chart showing the narrative measurement gap across different levels
Only 20% of organizations effectively measure cultural/structural impact from narrative initiatives

Most significantly, they've introduced "Decision Criteria Alignment" as a core skill: how well does your story map to how the decision-maker actually thinks? Not how they should think, not how you think—but their actual mental model for evaluating options.

The shift in language tells the story: the goal is no longer just "understanding" but adoption of the insight. You haven't succeeded when your audience says "I get it." You've succeeded when they act on it. Duarte is now measuring effectiveness by what happens after the presentation ends, not what happens during.

The Measurement Revolution Has Arrived

We're moving from "Did they like it?" to "Did their behavior change?" The tools are here—brain scans validating story structures, AI predicting audience response, business metrics tied to narrative quality. The question isn't whether to measure presentation effectiveness. It's whether you're willing to see what the data reveals about your current approach.