Market Assessment

The Canvas Wars

This week, OpenAI entered the visual workspace arena. Meanwhile, specialized tools are eating the generalists' lunch from below. Here's what's actually happening in workflow presentation tools.

Listen
Abstract visualization of digital workflow tools transforming into structured diagrams
01
Napkin sketch transforming into digital infographic

The Napkin Becomes the Presentation

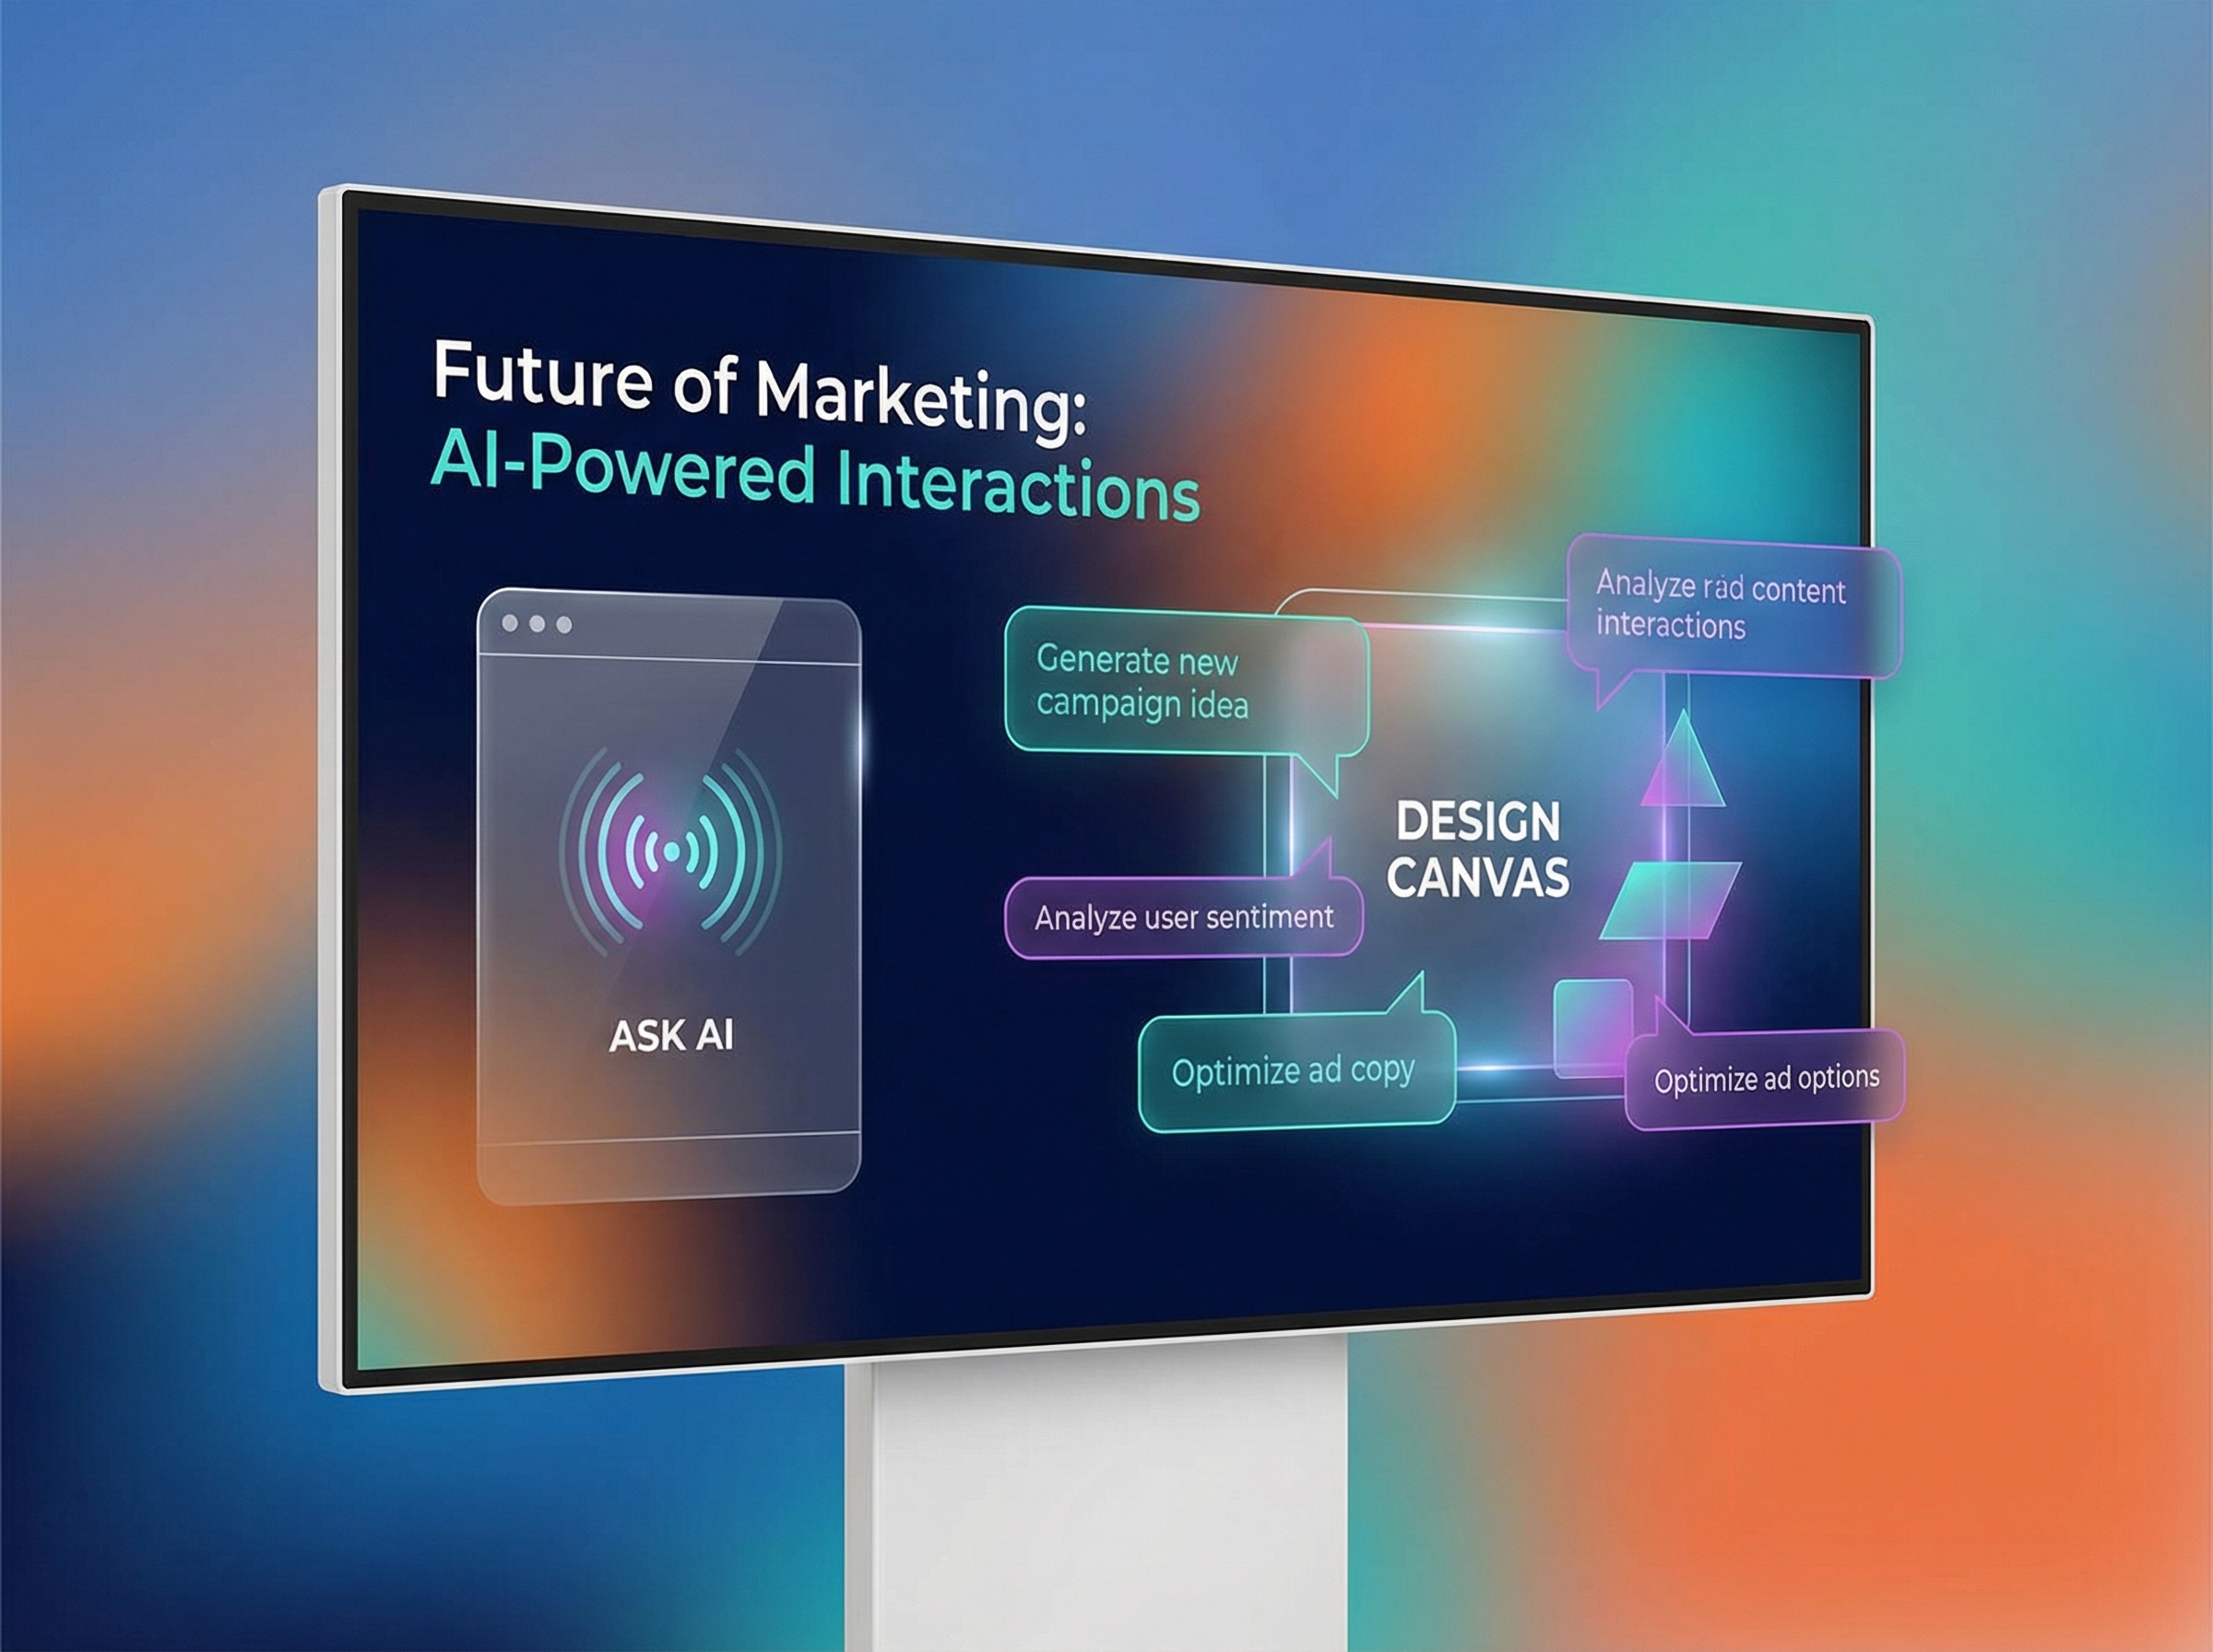
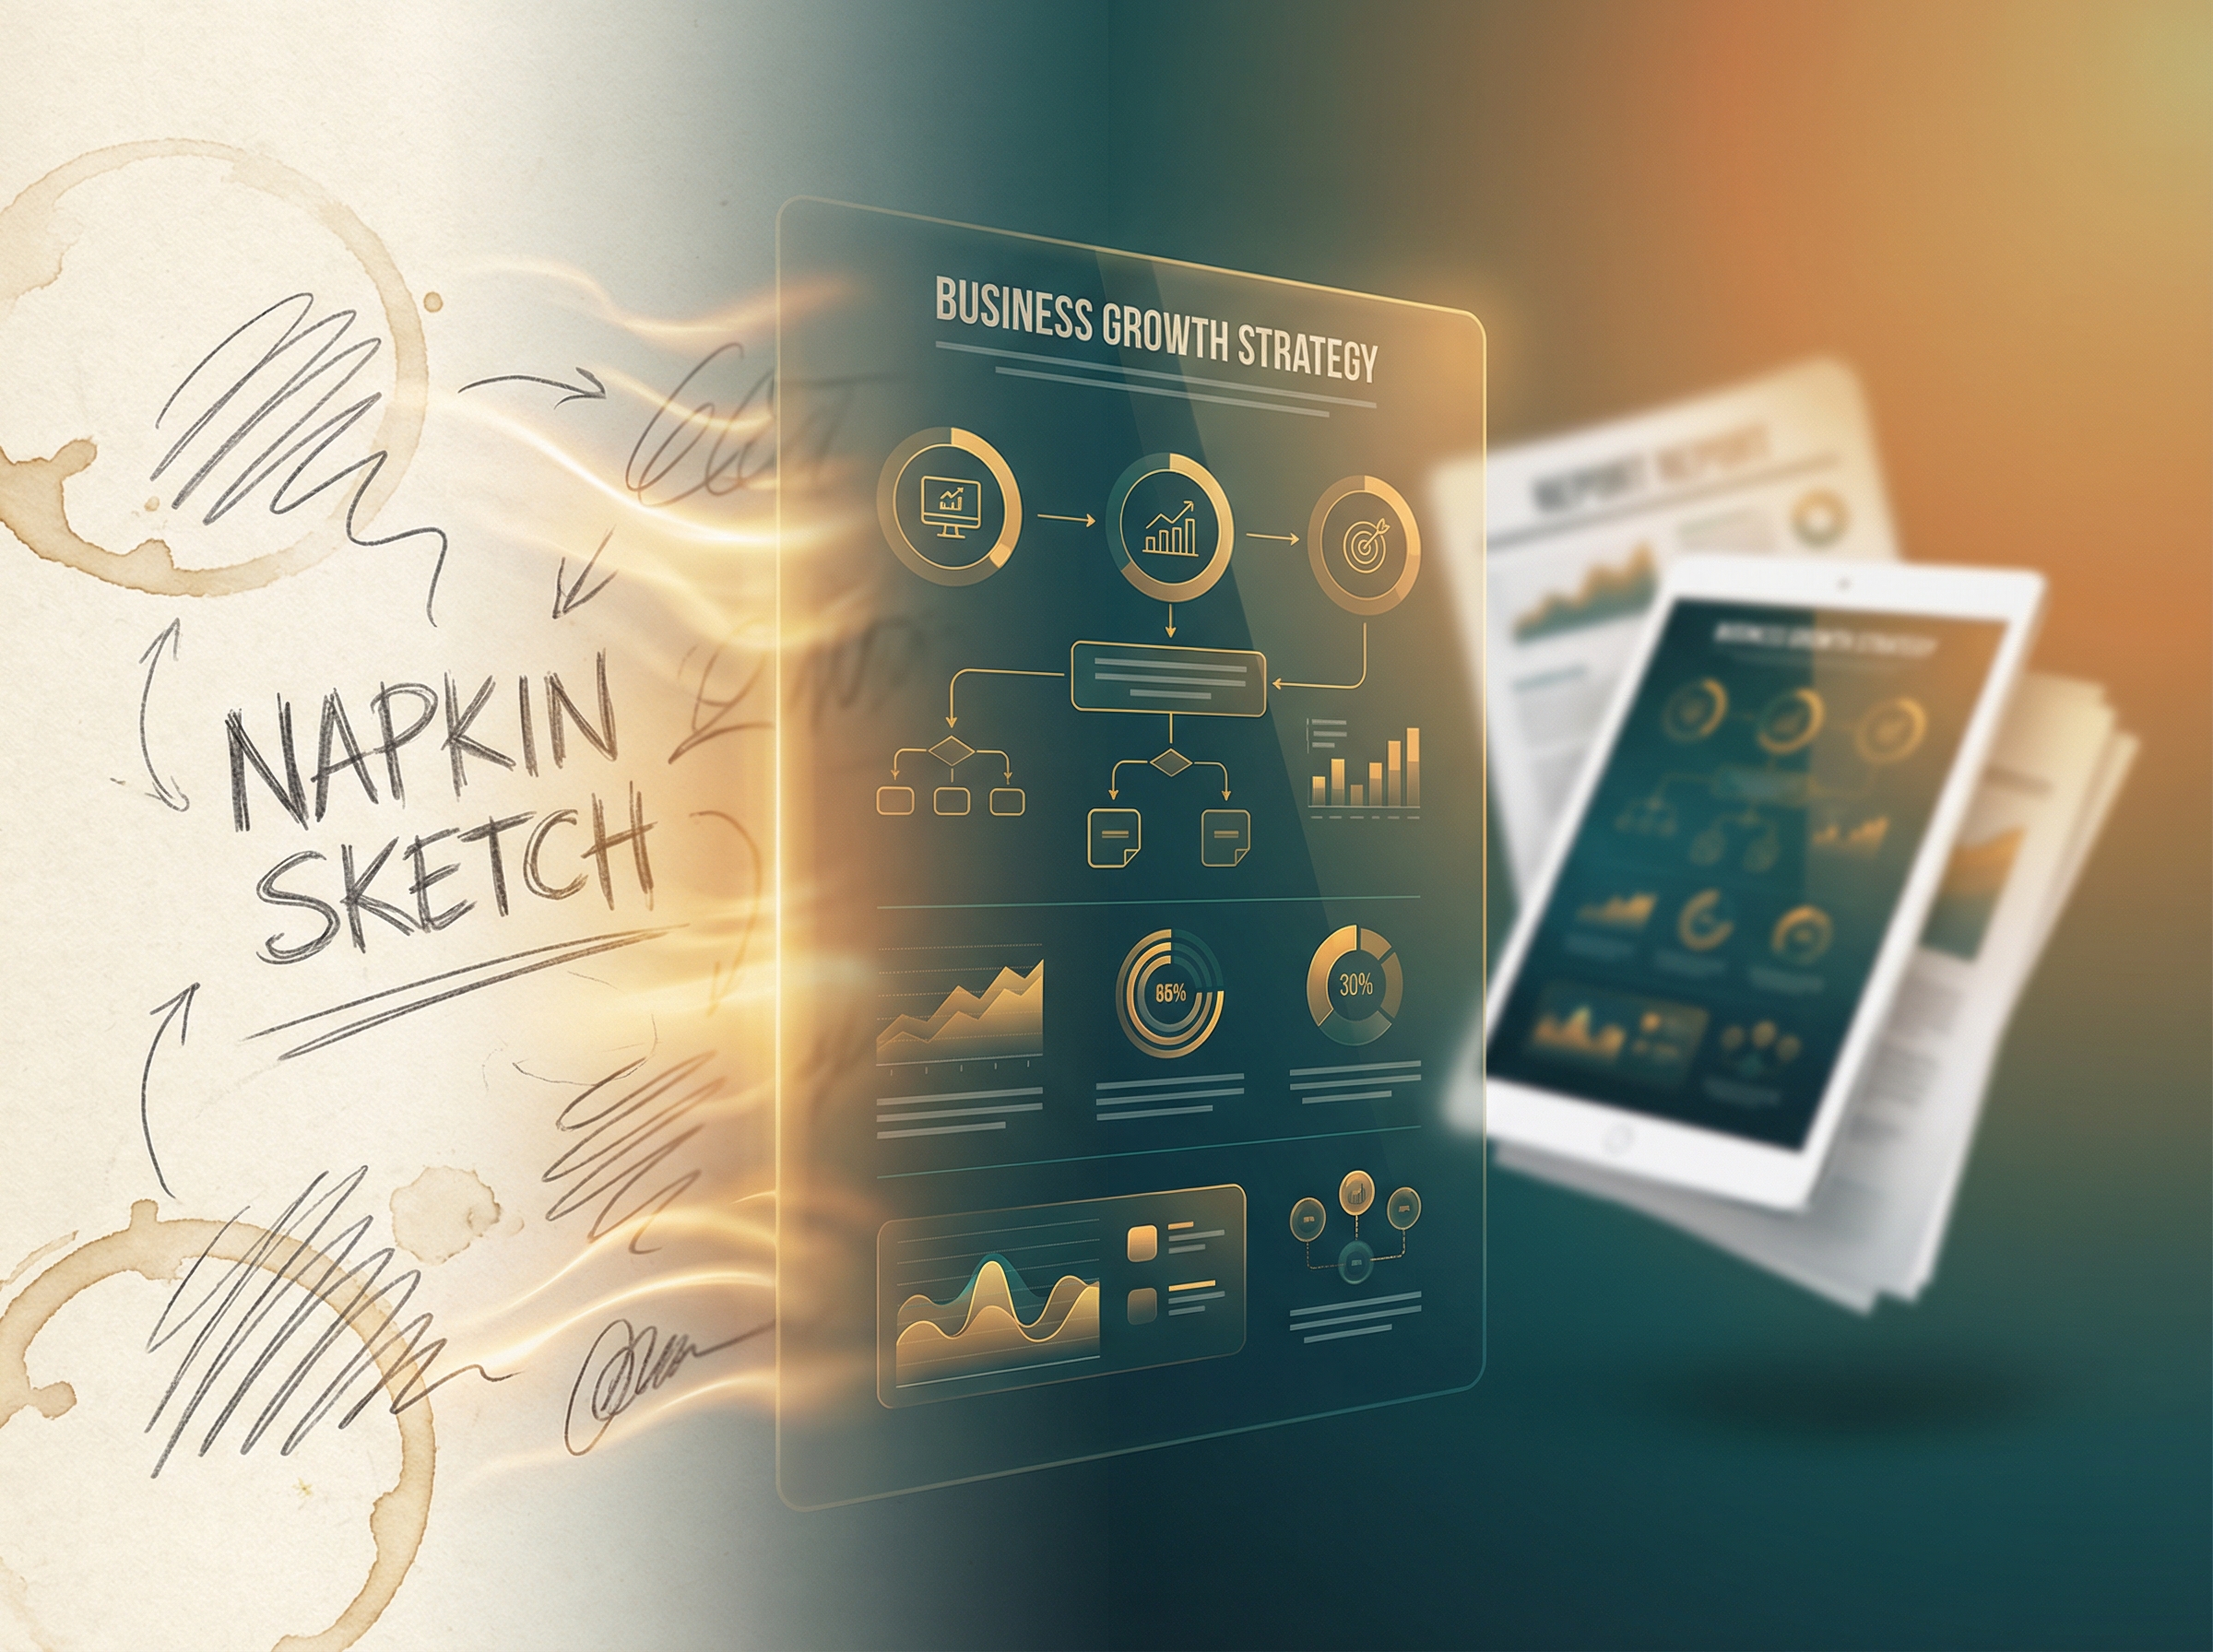
When someone says "let me sketch this out," they rarely mean "let me spend 45 minutes in Lucidchart." Napkin.ai gets this. The tool is gaining serious traction for what I'm calling "micro-visual generation"—turning a paragraph of business text into a polished infographic in seconds, not hours.

What's interesting here isn't the AI (every tool has that now). It's the use case. Napkin.ai isn't trying to replace your presentation software. It's trying to replace that moment when you paste a wall of text into a Slack message and hope people read it. They don't.

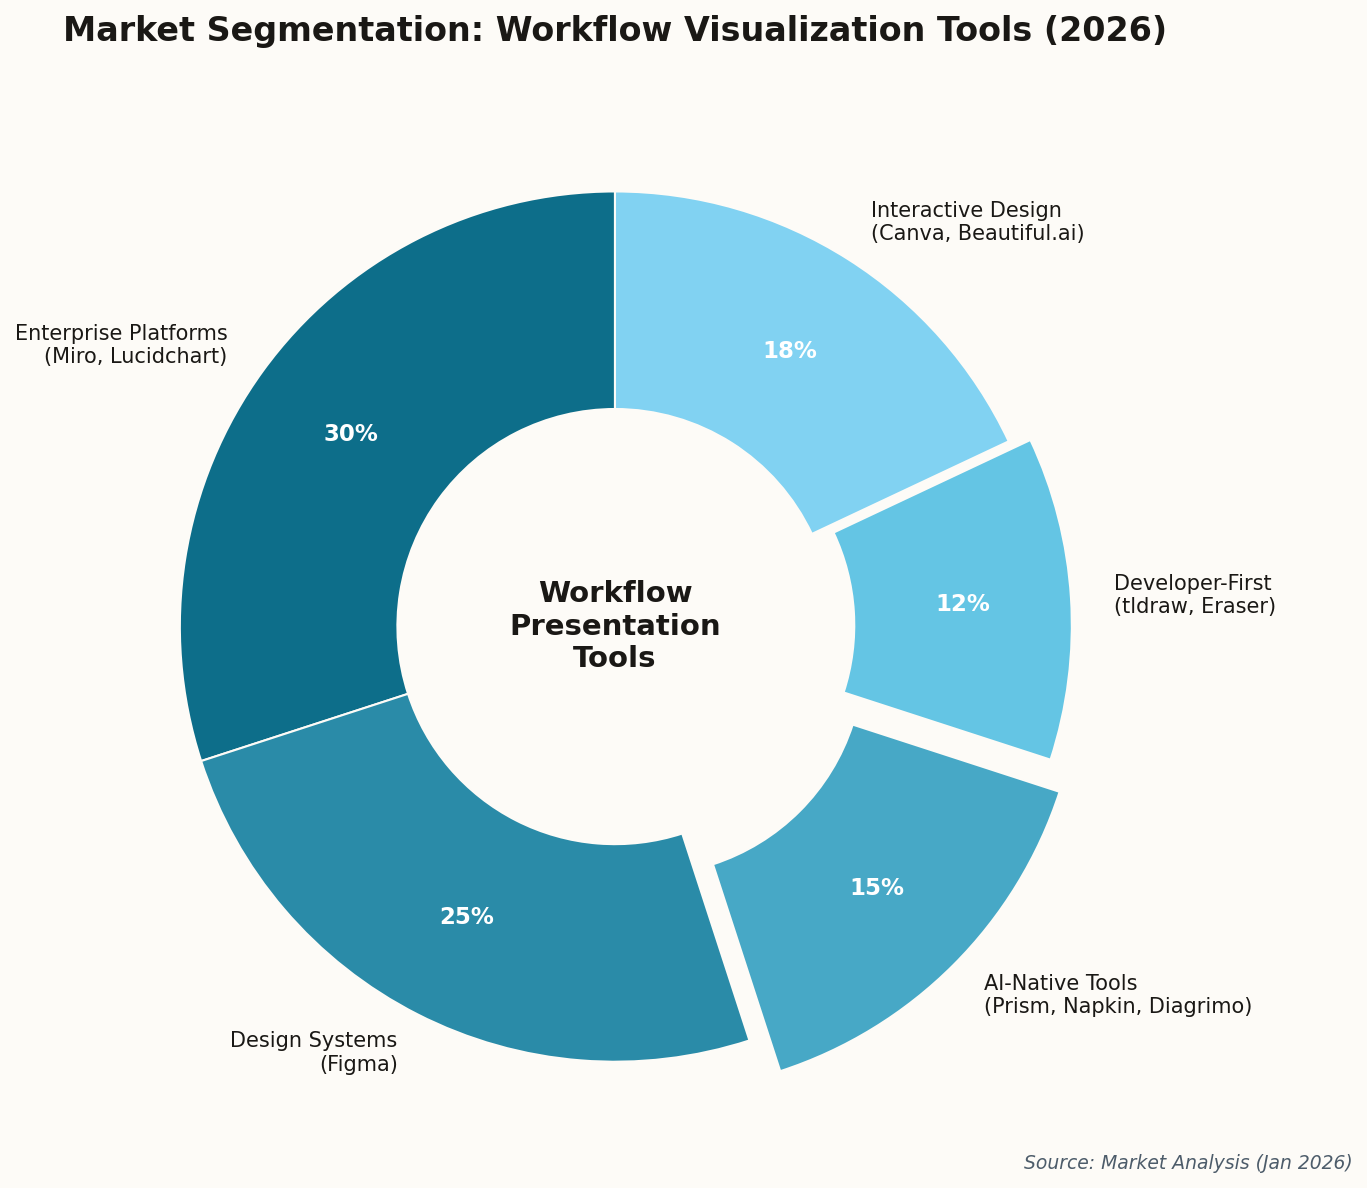
The bet: full-deck presentations are overkill for 80% of business communication. Most people just need one good visual that makes a point stick. If that's true, the $3 billion presentation market might be getting unbundled from below—not by a better PowerPoint, but by a hundred lightweight visual generators optimized for specific contexts.

02
Geometric prism refracting light into diagrams

OpenAI Enters the Canvas Business

OpenAI launched Prism this week, and it's not subtle about the target. This is a research workspace that generates equations, charts, and structured diagrams alongside text—powered by GPT-5.2. They're going after Miro and Eraser directly.

The timing matters. For two years, the dominant AI narrative was "chat interface for everything." Now OpenAI is saying: sometimes you need a canvas. Sometimes the output isn't text—it's a diagram, a flow, a structured visual that represents relationships the prose can't capture.

Scatter plot showing competitive landscape of workflow tools
Competitive landscape: AI integration level vs. market specialization. Prism enters at maximum AI integration with moderate specialization.

This is a validation signal for the entire category. When OpenAI builds a dedicated visual workspace rather than just bolting diagram generation onto ChatGPT, it's saying the market is big enough to warrant a standalone product. Figma and Miro should pay attention.

03
Infrastructure diagram emerging from code

Eraser Turns Your Terraform Into Docs

Here's a truth every engineering manager knows: architecture diagrams are lies. Not because anyone means to deceive, but because the diagram was drawn last quarter and the code changed six times since then. Eraser's new Infrastructure-as-Code feature addresses this by auto-regenerating diagrams from Terraform commits.

Bar chart showing documentation time savings
Time per document: manual documentation vs. Eraser's IaC integration. Case studies report 90% reduction.

Case studies this week claim 90% reduction in documentation time. Even if that's marketing math, the direction is clear: documentation that updates itself is worth more than documentation that's manually maintained (and therefore perpetually stale).

This is Eraser betting that the way to beat generalist tools like Miro isn't to out-feature them, but to be so specific to engineering workflows that they can't follow. It's the vertical SaaS playbook applied to diagramming.

04
Interactive chatbot emerging from presentation canvas

Canva Slides Now Talk Back

Canva and Jotform announced an integration that lets you embed AI chatbots directly into Canva designs. Your presentation can now take a booking. Your landing page can answer questions. The static slide deck becomes an interactive application.

I'm skeptical about the execution—embedded chatbots often feel gimmicky—but the strategic direction is significant. Canva is positioning presentations not as files you export, but as interactive experiences you deploy. The PowerPoint-style "deck as PDF" model is getting old.

Donut chart showing market segmentation
Market segmentation in workflow presentation tools. Interactive design tools (including Canva) represent 18% of the current market.

If you're building presentations that need to collect data, schedule meetings, or guide users through decisions, this is actually useful. If you just need to brief executives, probably stick with slides that don't require internet access.

05
Digital whiteboard with database storage visualization

tldraw Goes Local-First

tldraw released version 4.3.0 with SQLite support for TLSocketRoom. If you're not building developer tools, that sentence means nothing. If you are, it means you can now self-host a collaborative whiteboard with robust local-first data persistence without much effort.

This is the "developer-first" diagramming play: instead of competing with Miro on features, tldraw competes on embeddability and ownership. You can't white-label Miro and drop it into your product. You can with tldraw.

The local-first architecture matters for more than just developers. It's a privacy story. It's an offline story. It's a "your diagrams don't live on someone else's server" story. As enterprises get pickier about where their data lives, this positioning gets more valuable.

06
Text transforming into structured diagrams

A Startup for Every Diagram Type

Diagrimo launched on Product Hunt with a specific pitch: text-to-diagram generation for fishbone diagrams, flowcharts, and pyramid charts. Not "any visualization"—just those three. And they're not alone. The market is fragmenting into a swarm of specialists.

Timeline showing this week's workflow tool activity
This week in workflow tools: 7 significant developments across launches, features, partnerships, and releases.

The question for Lucidchart and the generalist platforms: is the market moving toward one tool that does everything, or a portfolio of specialized tools that each do one thing exceptionally well? History suggests the latter in mature markets.

When someone needs exactly a fishbone diagram and nothing else, will they open their enterprise-licensed general-purpose tool, or just use the thing that does fishbone diagrams perfectly? The marginal cost of another SaaS subscription approaches zero. The friction of learning another tool is real but decreasing.

The Fragmentation Play

The workflow visualization market is splitting, not consolidating. On one side: AI giants like OpenAI entering with horizontal plays. On the other: dozens of specialists owning narrow verticals. The generalists in the middle? They're the ones who should be nervous. The question isn't whether your tool has AI—they all do. It's whether you're differentiated enough that AI can't commoditize you.