Economic Outlook

The Odds of a Second Great Depression

Wall Street's biggest banks disagree about whether we're headed for trouble. The yield curve just flashed a warning. And the Fed's ammunition is running low. Here's what the smart money actually thinks about America's economic future.

Listen
American economic landscape at twilight with Wall Street buildings casting shadows, storm clouds gathering on the horizon with a sliver of golden light
Abstract yield curve visualization crossing from negative to positive territory
01

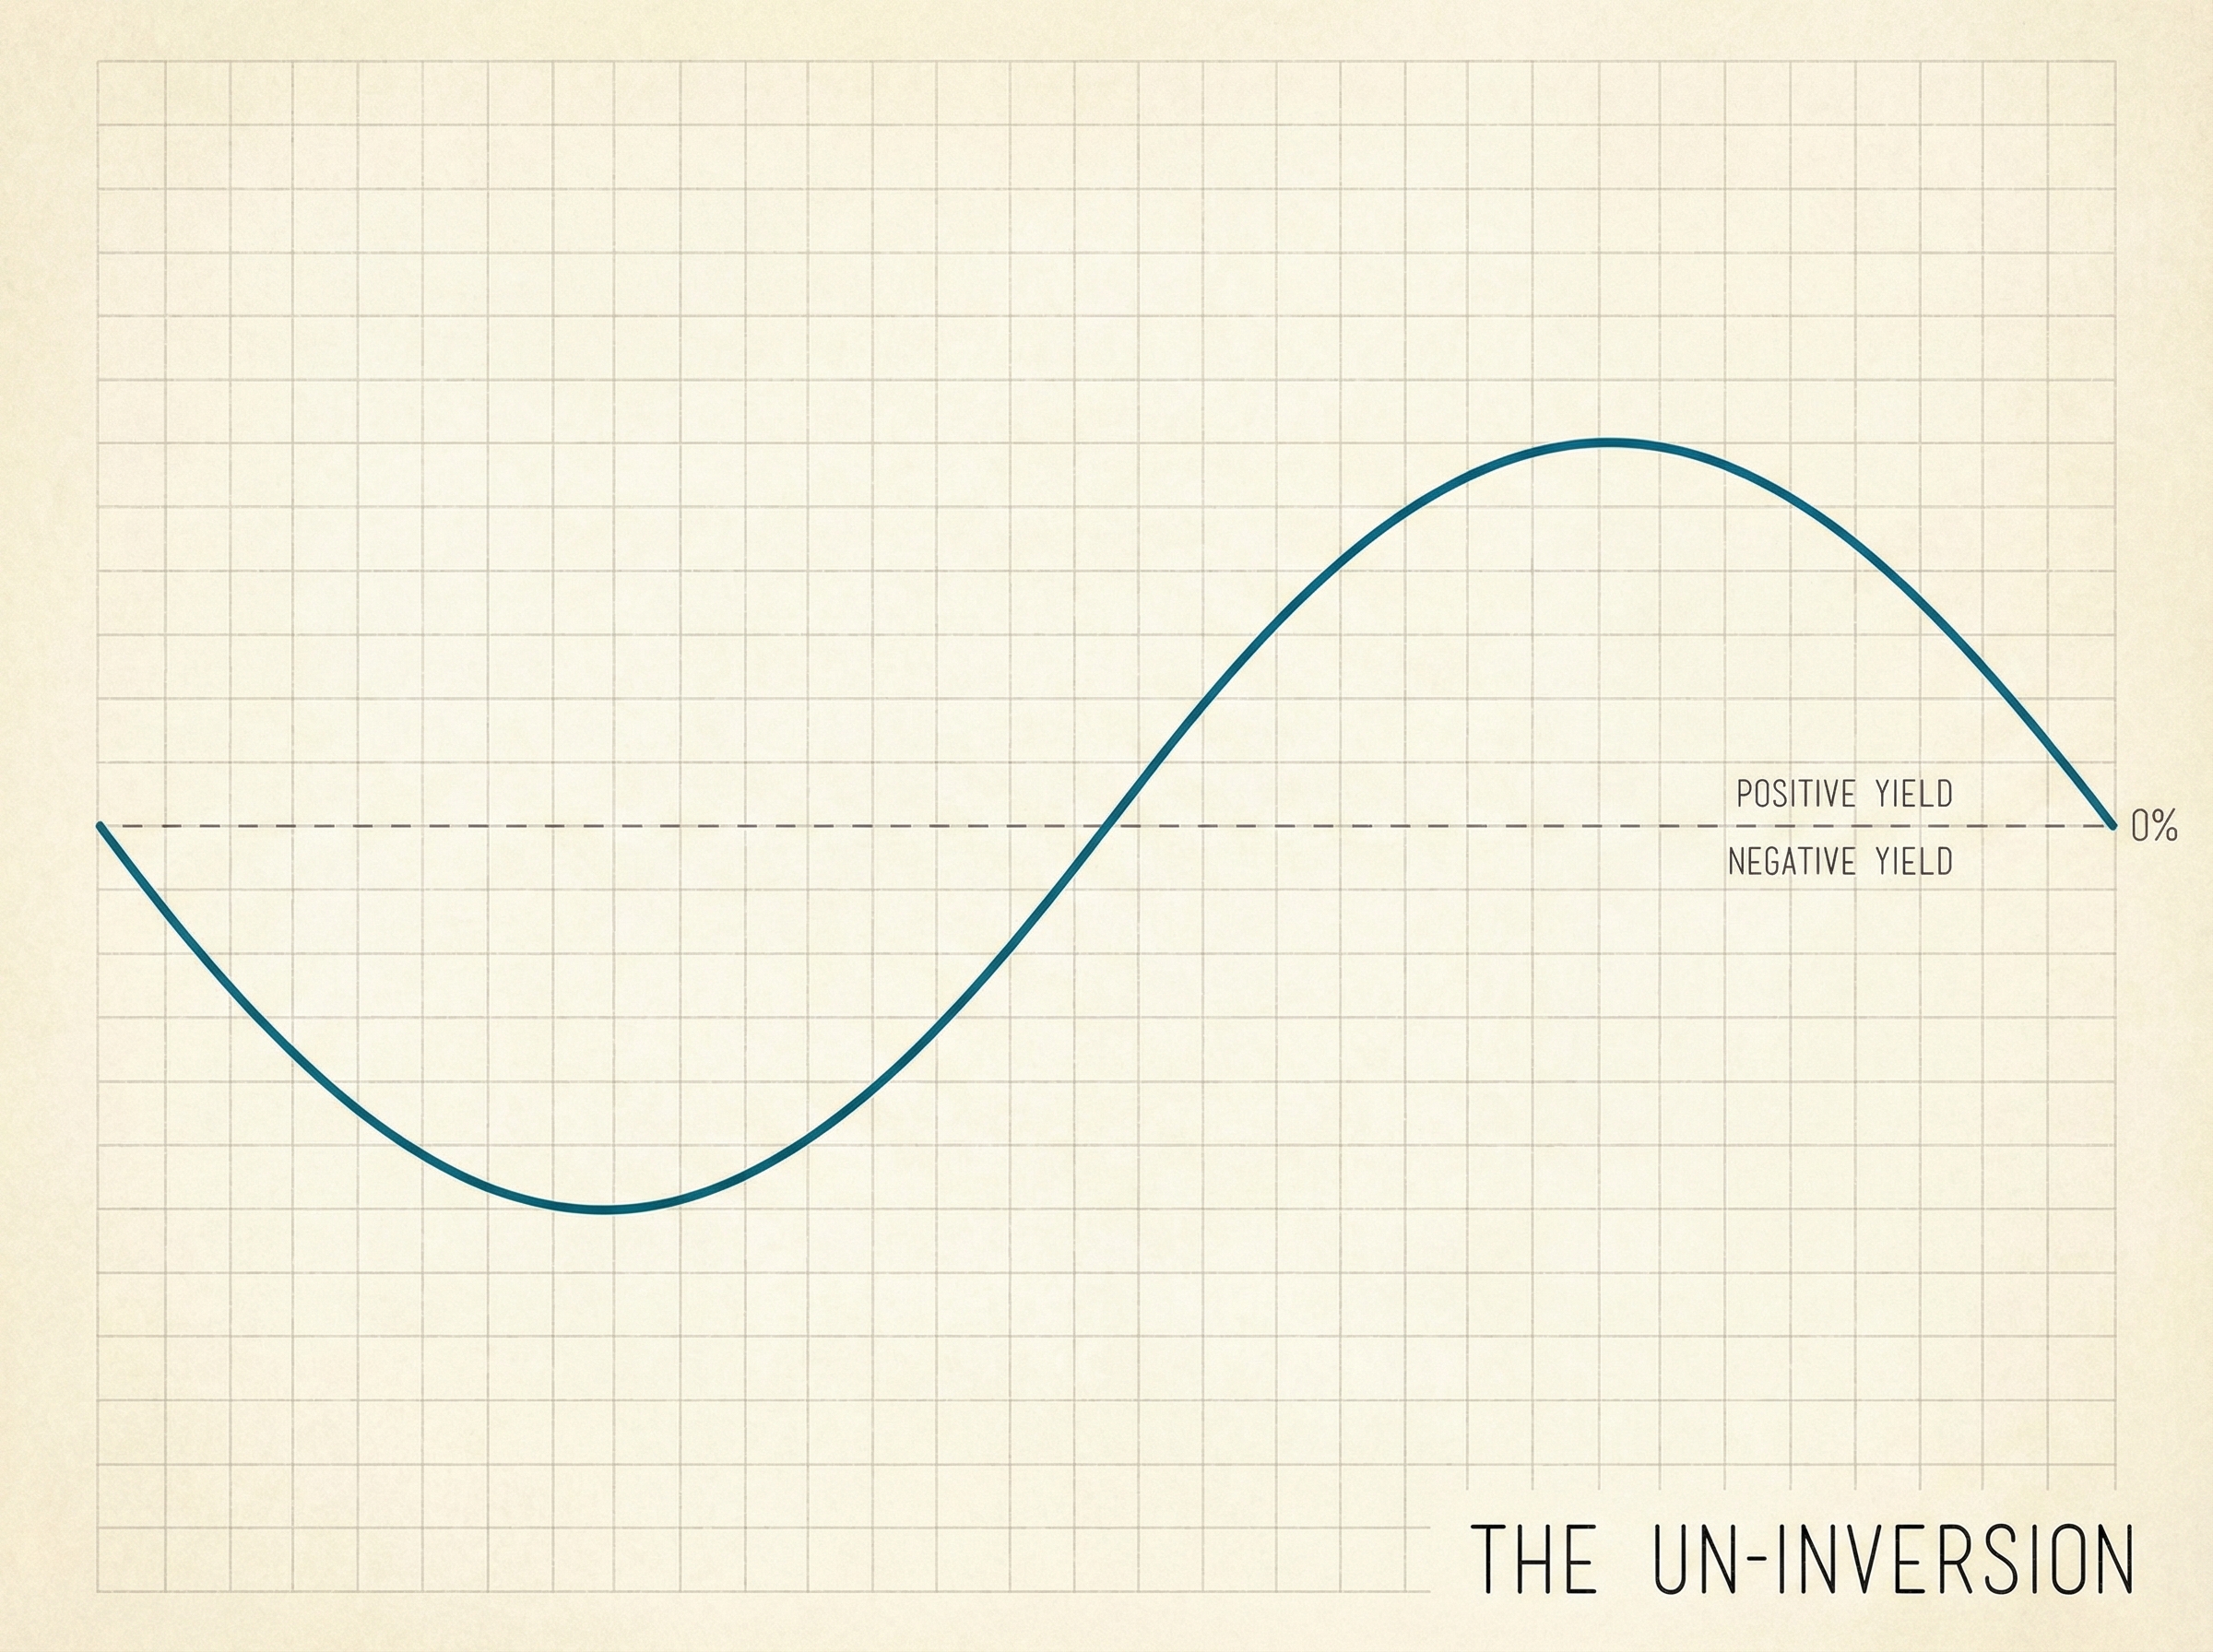
The Yield Curve Just Started the Clock

The 10-year minus 2-year Treasury spread has finally "un-inverted"—crossing back into positive territory after one of the longest inversions in modern history. If you're breathing a sigh of relief, don't. The un-inversion is the warning, not the inversion itself.

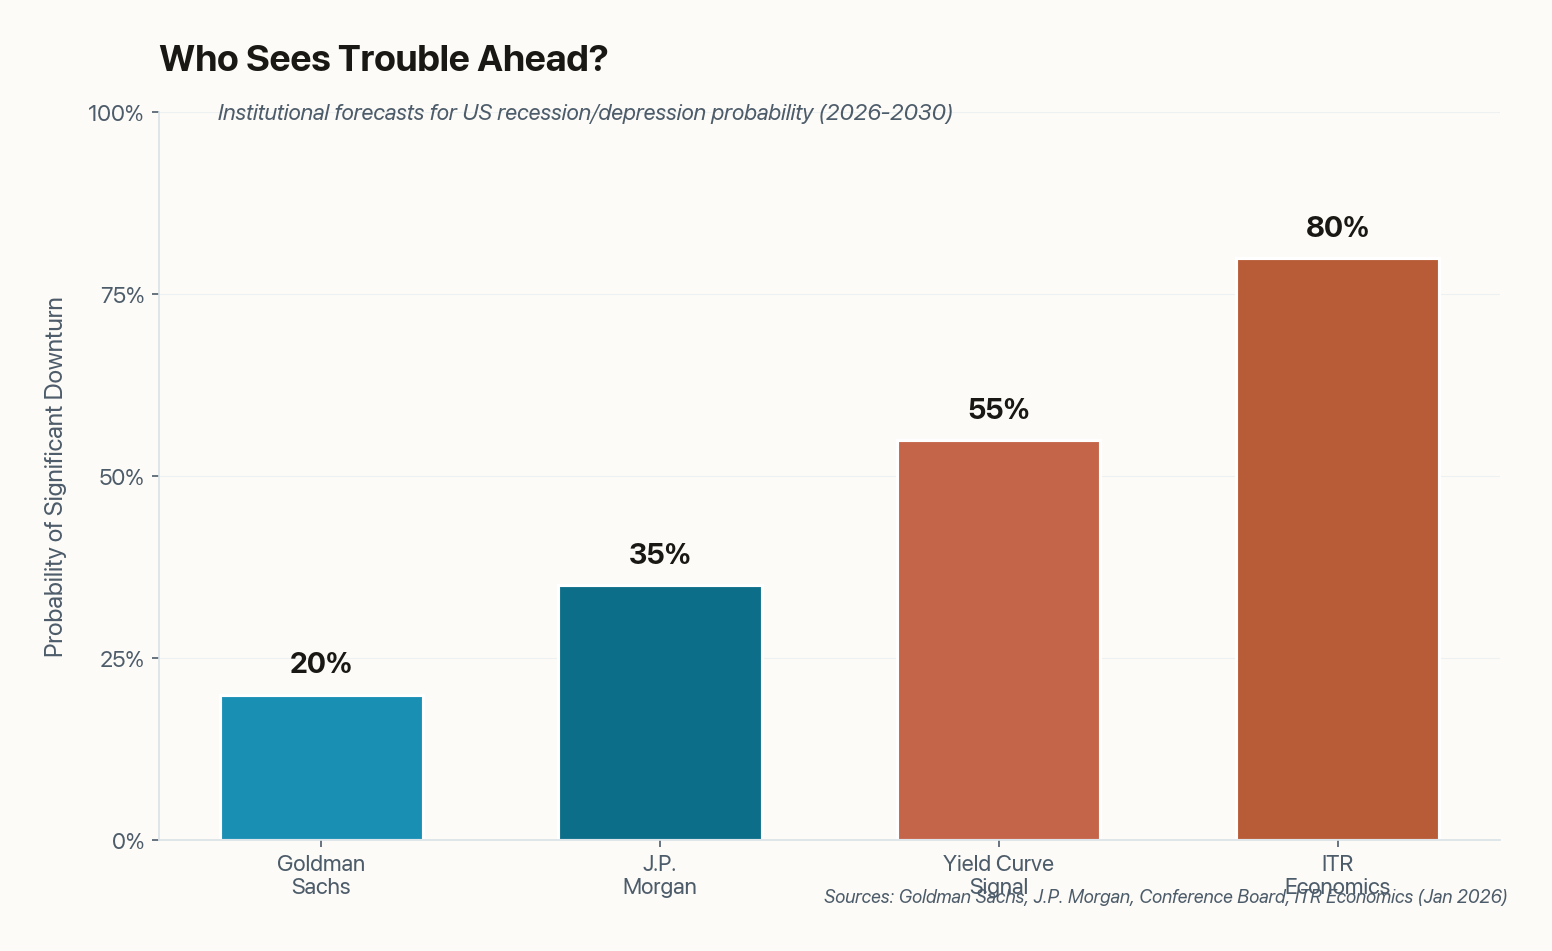
Here's the pattern that's spooked economists for decades: the yield curve inverts, everyone panics, nothing happens for a year or two, people forget about it, and then the recession arrives—usually 6 to 18 months after the curve normalizes. That's exactly where we are now. The Conference Board has been tracking this signal since 1966, and it's never cried wolf.

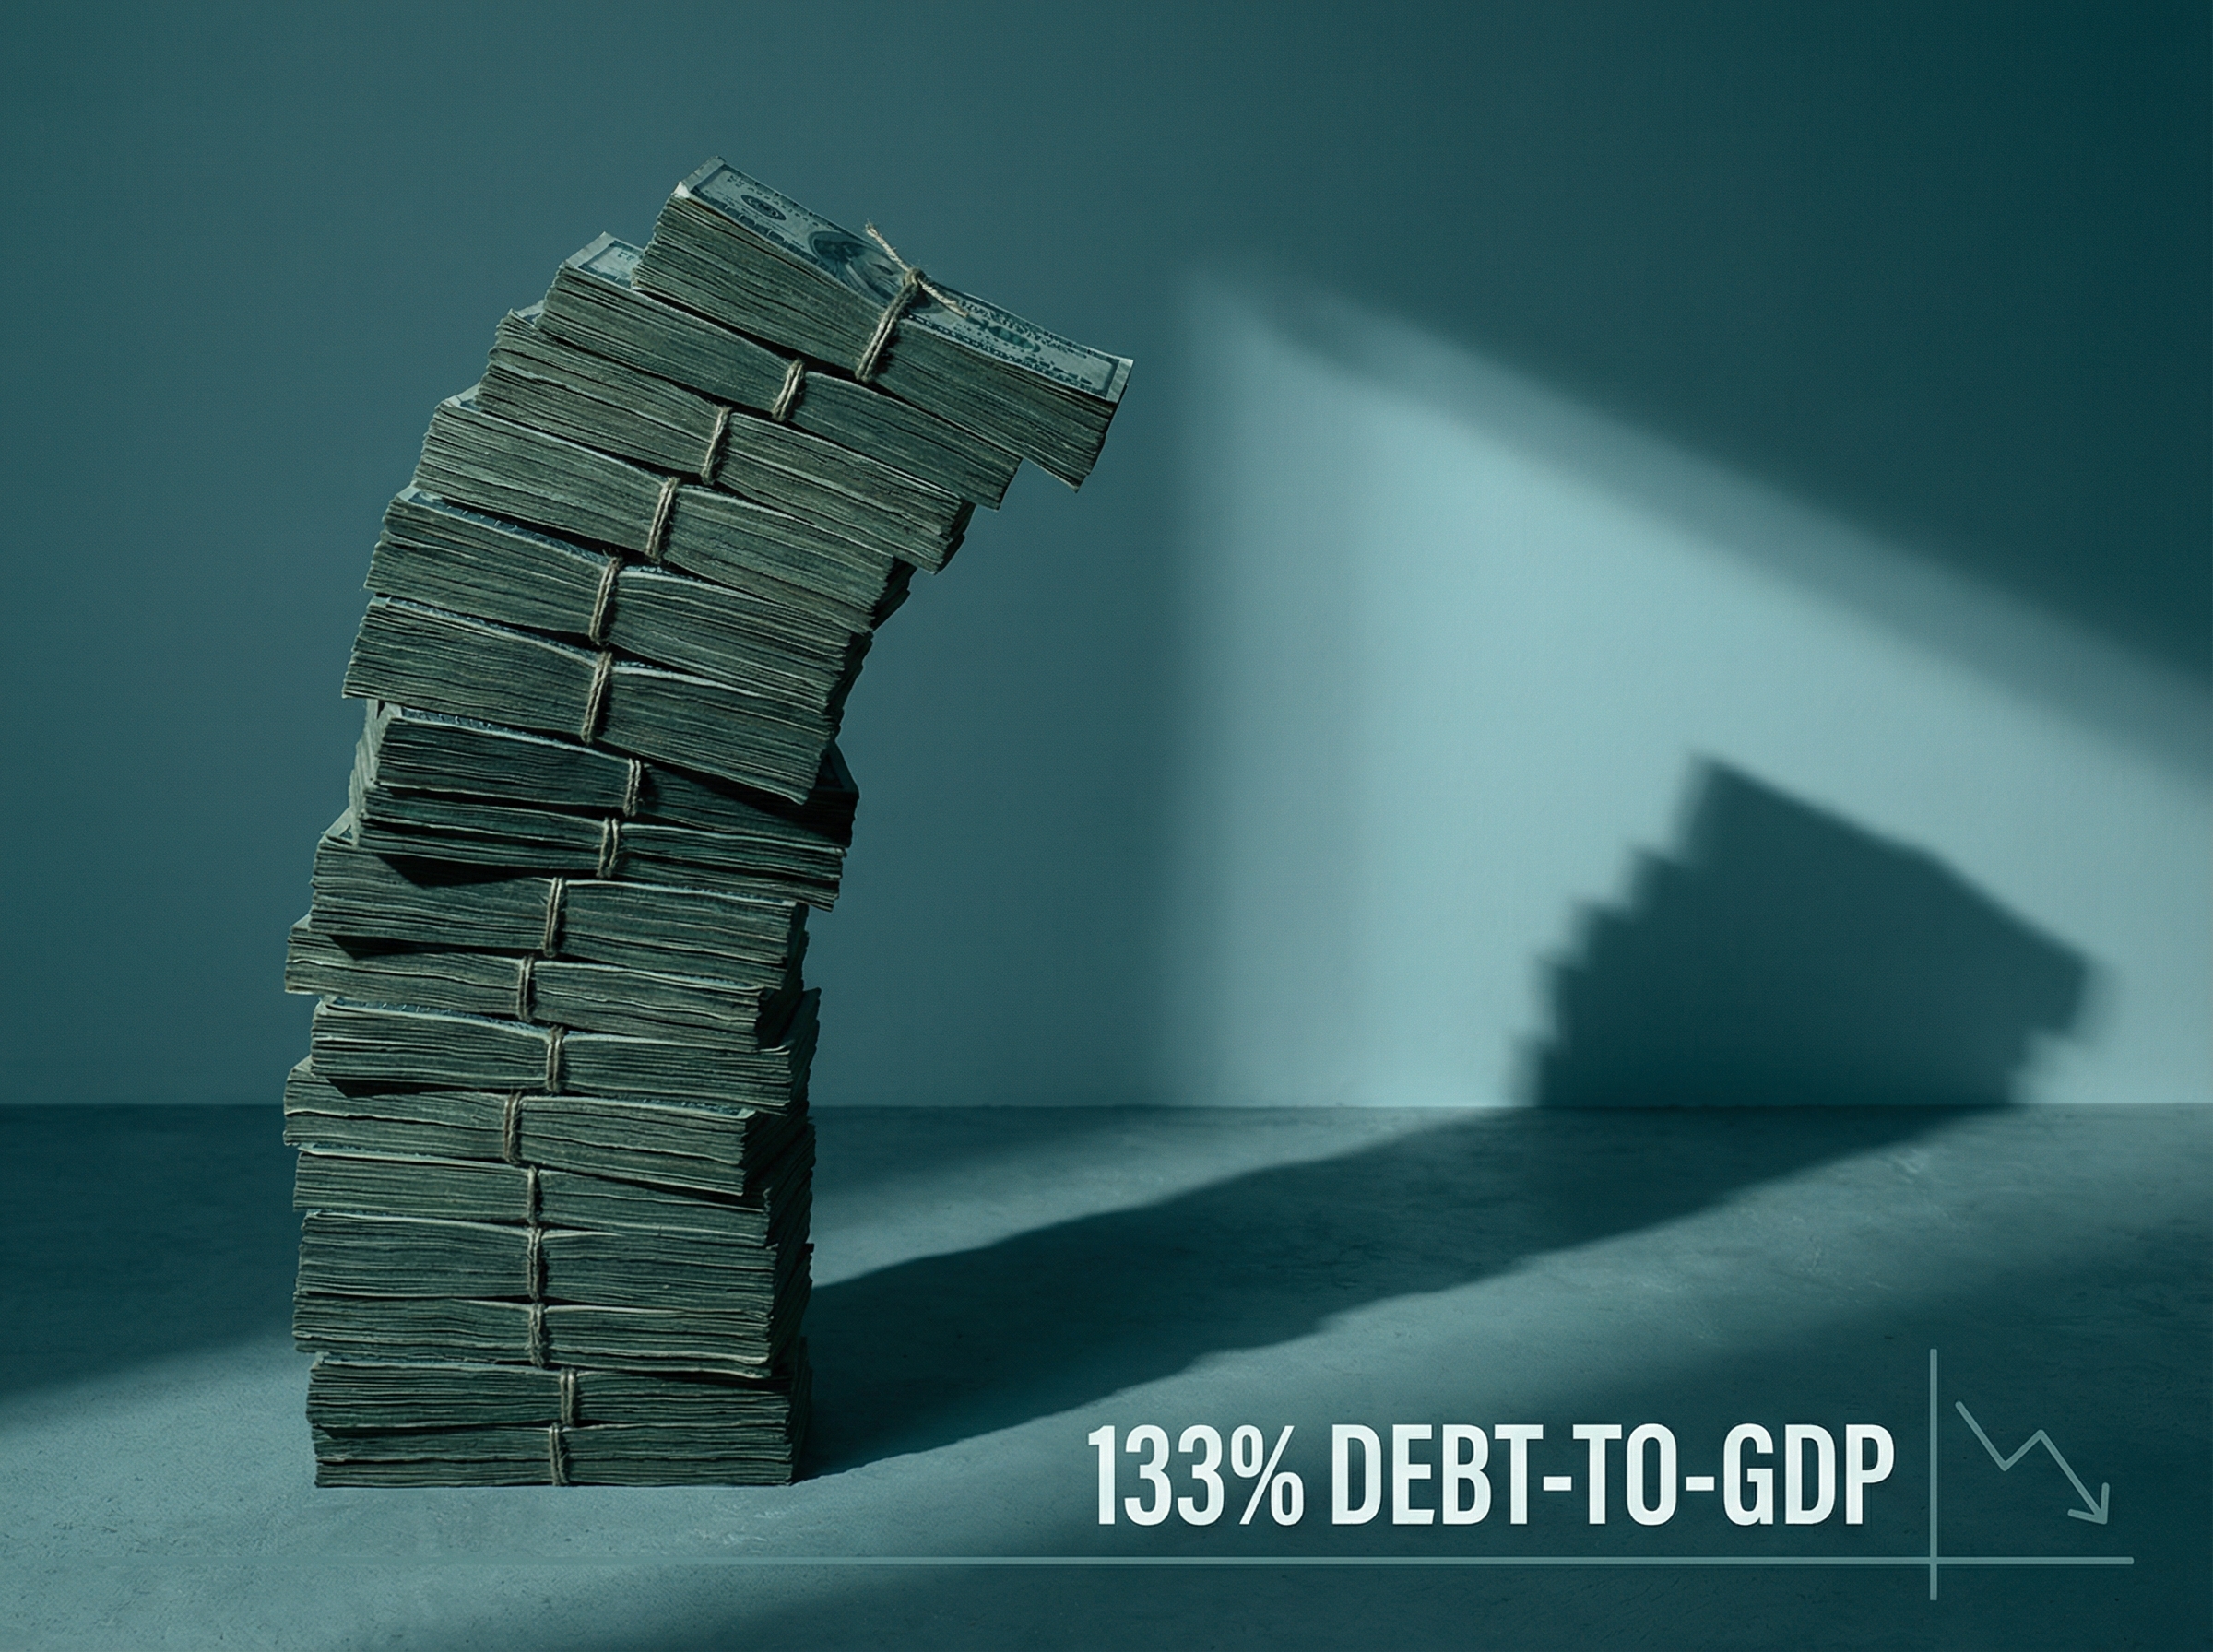
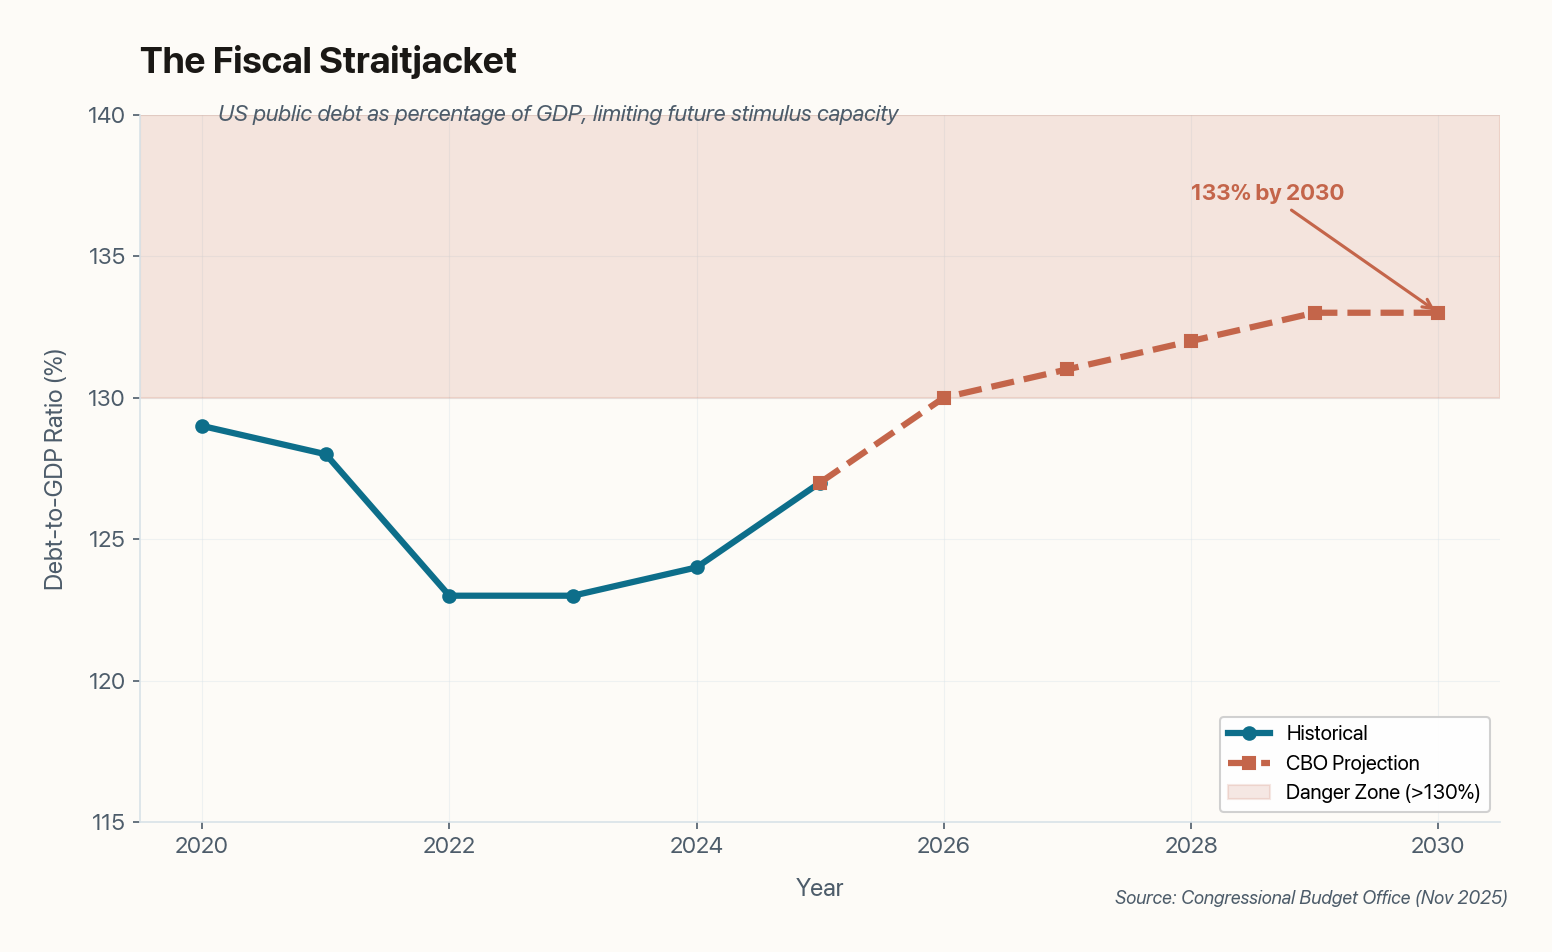
The steepening we're seeing in early 2026 isn't a sign of health—it's long-term yields staying stubbornly high because the Treasury keeps flooding the market with new debt. Translation: the bond market is betting that either inflation sticks around, or the government's credit risk is rising, or both. Neither interpretation suggests smooth sailing.

Commercial airplane making a smooth landing at sunset, metaphor for economic soft landing
02

Goldman Sachs Still Believes in Soft Landings

Not everyone sees storm clouds. Goldman Sachs is holding firm at just 20% recession probability for 2026, paired with a forecast of 2.5% GDP growth. The US Chamber of Commerce is even more bullish, predicting growth exceeding 3%.

Their argument boils down to three pillars: labor markets that refuse to crack, inflation that's slowly capitulating, and the AI productivity boom that could offset any debt-driven drag. It's not crazy. Unemployment remains near historic lows. Consumer spending has been resilient even as credit card rates hit 25%. And every CFO in America is trying to figure out how to replace headcount with Claude and Gemini.

The contrarian case isn't that depression is coming—it's that depression isn't inevitable. If productivity gains from AI compound faster than the debt burden, we could grow through the headwinds entirely. That's a big "if," but it's not a fantasy.

Bar chart comparing recession probability forecasts from Goldman Sachs (20%), JP Morgan (35%), yield curve signal (55%), and ITR Economics (80%)
Institutional forecasts vary wildly—from Goldman's 20% to ITR Economics' explicit depression warning. The truth probably lies somewhere in the uncomfortable middle.
Wall Street buildings reflected in rain puddles with distorted ripples
03

JP Morgan Says One-in-Three Odds Aren't Great

JP Morgan's December outlook puts recession probability at 35%—down from 40% earlier in 2025, but still uncomfortably high by historical standards. Their framing is careful: "The expansion should continue through 2026... however, recession risks remain elevated relative to historical averages."

This is the consensus institutional view. Not doom, but not complacency either. The problem isn't any single indicator—it's the convergence. Central banks are transitioning from "easing" to "holding," which creates a delicate pivot point for growth. Rate cuts help, but they can't fix structural debt overhangs or demographic drags.

Worth noting: JPM is specifically forecasting recession, not depression. A recession means negative GDP for two quarters. A depression means 10%+ GDP decline and 25%+ unemployment—1930s territory. The odds of that remain in the single digits according to most major banks. But "single digits" isn't zero.

Industrial gauge with needle pointing to the low end, representing economic slowdown
04

The Economic Engine Is Losing Steam

The US Leading Economic Index declined 0.1% in November, following a 0.3% drop in October. That might sound like noise, but the LEI is designed specifically to predict business cycle turning points—and it's been persistently weak for months now.

The culprits? New manufacturing orders remain soft. Consumer expectations keep sliding. Credit conditions are tightening. These aren't recession indicators on their own, but together they paint a picture of an economy that's fragile—vulnerable to shocks in a way that a healthier economy wouldn't be.

The LEI's track record: It correctly signaled every recession since the 1970s, typically providing 6-12 months of advance warning. Its current reading suggests 2026 will see meaningful slowdown even if we avoid formal recession.

The gap between GDP headlines (still positive) and the LEI (persistently negative) creates a dangerous complacency. GDP is backward-looking. The LEI is forward-looking. Right now, they're telling different stories.

Precarious tower of dollar bills with dramatic lighting, representing national debt
05

The Debt Spiral Is the Real Danger

Here's the number that should keep policymakers awake: 133% debt-to-GDP by 2030. The federal deficit for 2025 is estimated at $1.9 trillion, and interest payments alone are set to double to $1.8 trillion by 2035. That's money that can't be spent on stimulus, infrastructure, or anything else.

Line chart showing US debt-to-GDP ratio rising from 124% in 2024 to projected 133% by 2030
The CBO's projection shows debt entering "danger zone" territory by 2028, with limited room for fiscal stimulus in the next downturn.

High debt acts as a "depression amplifier." When a downturn hits, governments normally spend their way out—hiring workers, cutting taxes, mailing checks. But when you're already running $2 trillion deficits in good times, there's less room to maneuver in bad times. You can still borrow, but at what cost? At what interest rate? And for how long before bond markets revolt?

The IMF has been sounding alarms about this for years. "High debt levels reduce the country's ability to respond to negative shocks," their latest report notes dryly. That's economist-speak for: if things go wrong, we're in trouble.

Empty toolbox on workbench with shadows where tools should be, metaphor for depleted policy options
06

The Fed's Toolbox Is Nearly Empty

This is what separates 2026 from 2008 and 2020: the policy arsenal is depleted. In 2008, the Fed cut rates from 5.25% to zero. In 2020, Congress passed $5 trillion in stimulus without blinking. Neither playbook works the same way today.

Bar chart comparing policy capacity in 2008 versus 2026, showing significant reductions in Fed rate cutting room, fiscal space, and inflation headroom
The "depleted arsenal" problem: almost every policy lever we used in 2008 and 2020 has less room to move today.

The Fed Funds rate is projected to hit ~3% by end of 2026. That's cutting room, but not much—and if inflation stays "sticky" at 3%, cutting to zero would reignite price spirals. The Fed is trapped between the need to stimulate and the need to contain inflation. Both matter. Neither can be ignored.

On the fiscal side, the $39 trillion debt load (expected by April 2026) makes another $2+ trillion stimulus package politically and financially difficult. Not impossible—Washington can always print more money—but the consequences get uglier each time. This is why ITR Economics explicitly uses the word "depression" in their 2030 forecast. It's not that bad things happen; it's that when bad things happen, we have fewer tools to stop the bleeding.

The Bottom Line

A full-scale depression remains a minority forecast—ITR Economics stands nearly alone in explicit prediction. But the conditions that could enable one are building: elevated debt, constrained policy, and an economy that's more fragile than GDP numbers suggest. The consensus 20-35% recession probability is uncomfortably high. The real question isn't whether trouble is coming, but whether we'll have the ammunition to fight it when it arrives.