Demographics & Population

The Slow Fade: America's 30-Year Demographic Reckoning

By 2040, immigration will be 100% of US population growth. By 2045, no racial majority. By 2054, one in four Americans will be over 65. The math is done. The question is whether we're ready.

Listen
Abstract visualization of America's demographic future with population pyramids morphing into hourglass shapes
Abstract visualization of population growth deceleration
01

The End of American Expansion

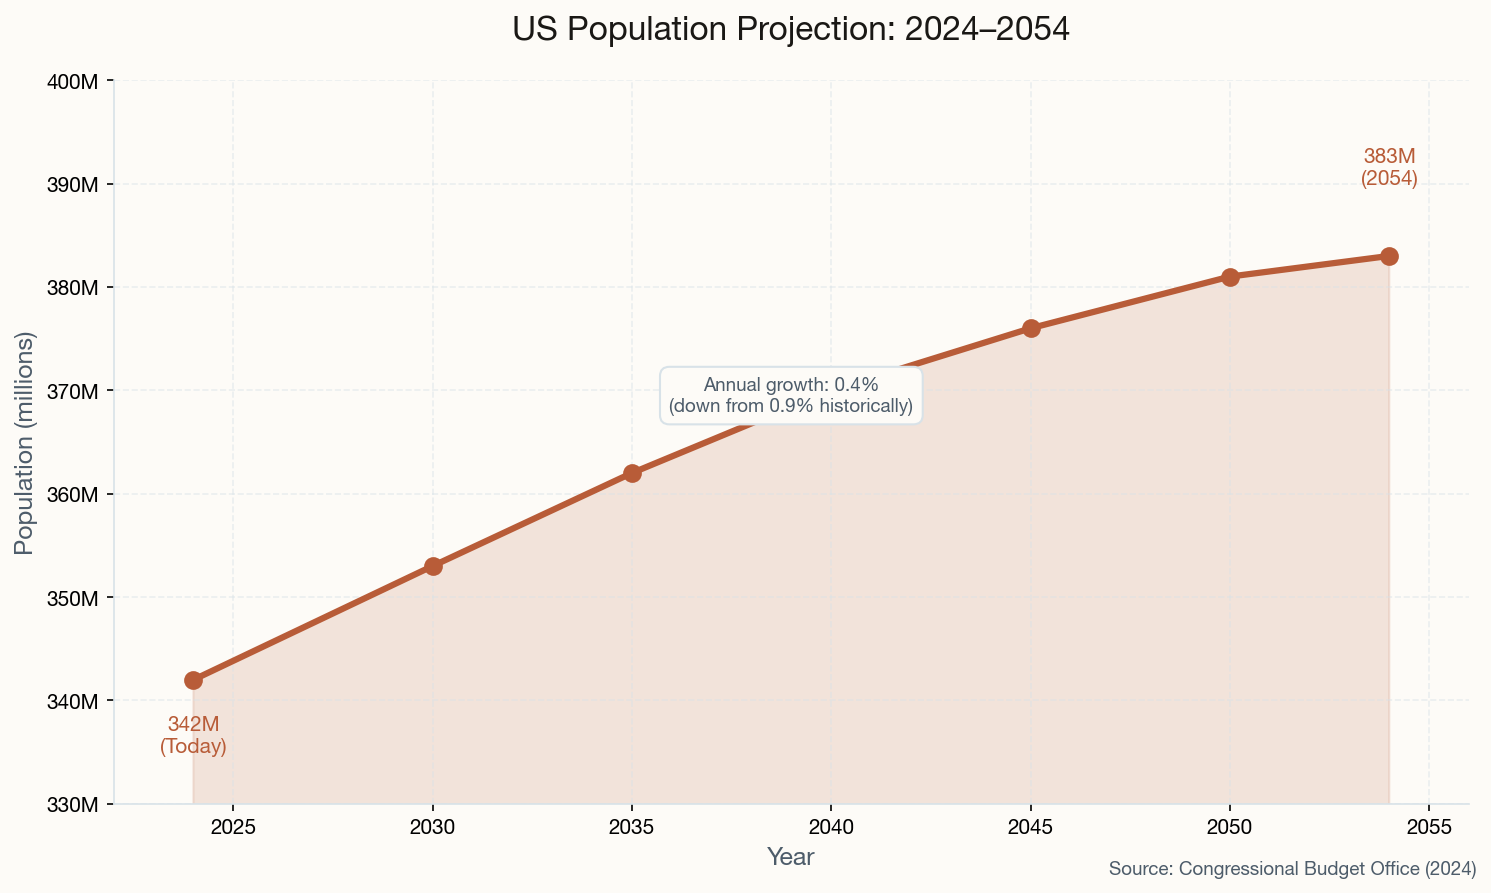
Here's a number that should reshape how you think about this country: 0.4%. That's the average annual population growth rate the CBO projects for the next 30 years. For context, the historical average since 1974 was 0.9%. We're not slowing down a little. We're cutting our growth rate in half.

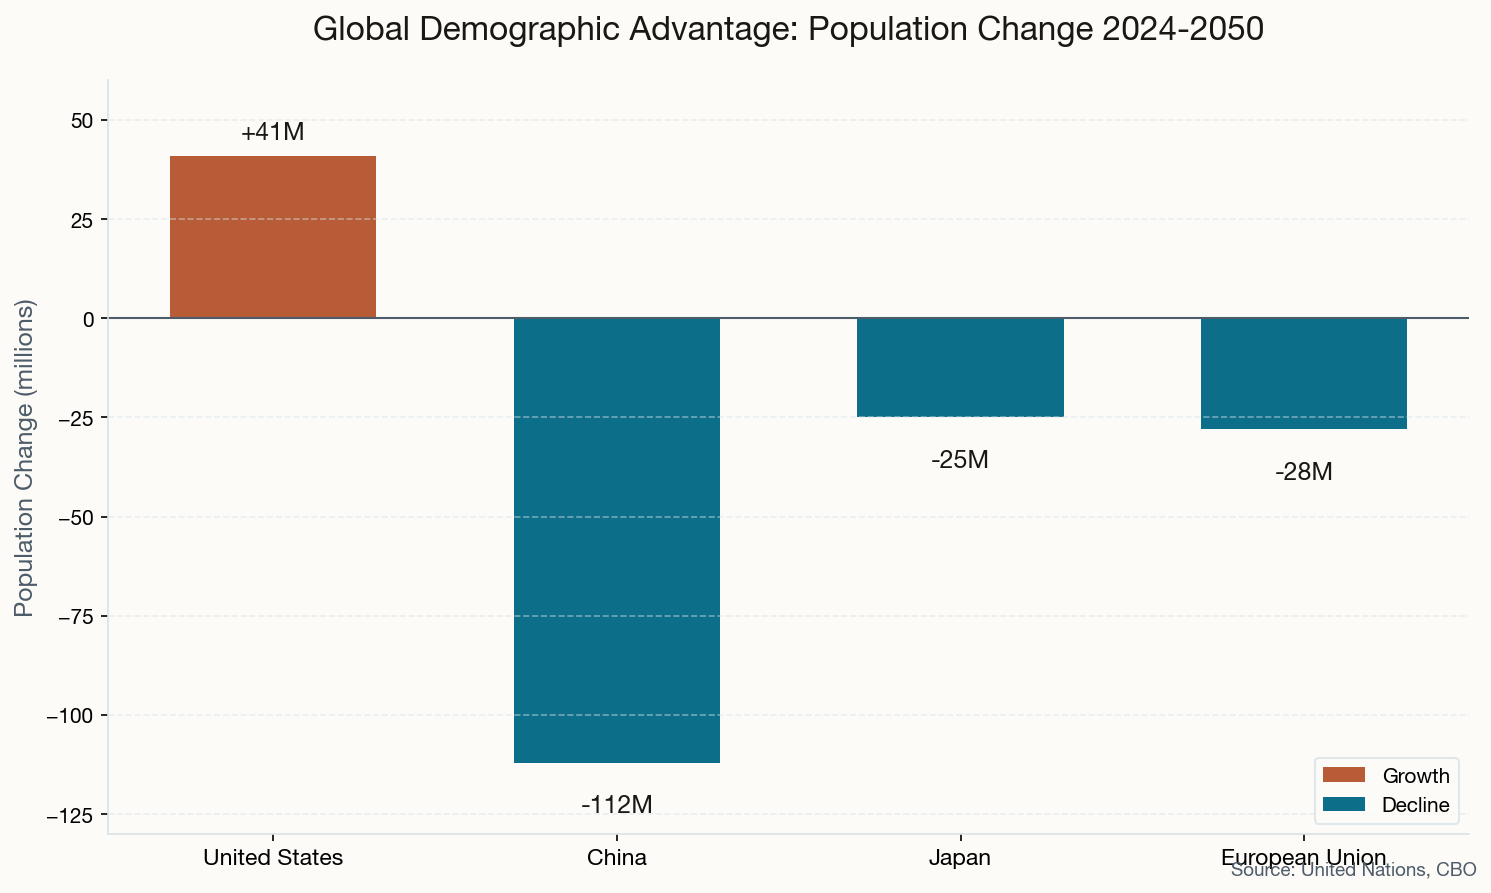
The trajectory: 342 million Americans today, 383 million by 2054. That's 41 million more people over three decades. Sounds like growth, right? Except here's the structural reality the CBO lays bare: without immigration, the US population would start shrinking by 2040. Not stabilizing. Shrinking.

US Population Projection 2024-2054 showing growth from 342M to 383M
US population will grow by 41 million over 30 years, but at half the historical rate. Source: CBO 2024

This isn't a temporary blip or a post-pandemic adjustment. It's structural. The CBO's projections assume net immigration of about 1.1 million people annually. That's not a ceiling or a floor, it's the level required to keep the population from declining. Immigration has gone from a political debate to a mathematical necessity.

The implications ripple through everything: housing demand, labor supply, tax base, infrastructure investment. Every long-term projection you've seen for the American economy needs to be recalibrated. The era of building for relentless expansion is over. Now we're building for managed transition.

Visualization of aging population with silhouettes aging from child to elderly
02

When the Old Outnumber the Young

In 2034, the Census Bureau projects a crossing point that's never happened in American history: for the first time, adults over 65 will outnumber children under 18. Think about that. A society with more grandparents than grandchildren. More people drawing from systems than paying into them.

By 2054, 23% of Americans, some 84 million people, will be 65 or older. The 85-and-older population will nearly triple. This isn't speculation. These people are already alive. The actuarial math is locked in.

Age Distribution Shift comparing 2024 vs 2054
The 65+ population grows from 16% to 23% of the total, while working-age adults shrink from 62% to 58%. Source: Census Bureau

The working-age population (18-64) drops from 62% to 58% of the total. Fewer workers supporting more retirees. The dependency ratio, the number of non-workers per worker, climbs relentlessly. Social Security and Medicare solvency calculations that already look strained become genuinely dire.

Healthcare systems will face demand unlike anything in their history. Not just more patients, but more complex patients, more chronic conditions, more end-of-life care. The infrastructure for aging, from housing to transportation to care facilities, barely exists at the scale we'll need.

This is the demographic winter that Europe and Japan hit first. The US was supposed to be the exception, the young country with the forever-young population. That exception is expiring.

Visualization of declining fertility with sparse nurseries
03

The 1.7 Problem

The total fertility rate (TFR) sits at 1.62 births per woman and is projected to hover around 1.70 through 2054. The replacement rate, the number needed just to maintain population without immigration, is 2.1. The US has been below replacement since 1972. Over half a century of demographic momentum is now exhausted.

US Fertility Rate from 1960 to 2054 showing decline below replacement
The US fertility rate dropped below replacement in 1972 and has never recovered. It's projected to stay at 1.70 indefinitely. Source: CBO

What's driving this? Pick your explanation. Women prioritizing education and careers. Economic precarity making parenthood feel unaffordable. Housing costs that make family formation feel impossible. Cultural shifts toward smaller families or no children at all. Delayed marriage. Delayed everything.

The CBO projects fertility for women under 24 will continue falling, while rising slightly for women 30-49. The age of first birth keeps climbing. But delayed childbearing has biological limits, and those limits translate into smaller completed family sizes regardless of initial intentions.

No country with sustained below-replacement fertility has ever returned to replacement through policy intervention alone. Hungary, Singapore, Japan, all have tried. All have failed. The only lever that actually moves population numbers is immigration. Which brings us back to that 1.1 million annual net migration the CBO assumes. Not a policy choice. A mathematical constraint.

US map standing tall while China, Japan, Europe shrink
04

The Last Growing Superpower

Here's the geopolitical silver lining, if you can call it that. While America grapples with slowing growth, its major competitors face outright collapse.

China will shrink by over 100 million people by 2050, falling from 1.4 billion to approximately 1.3 billion. The one-child policy's demographic echo is now playing out in empty maternity wards and closing schools. Japan drops from 125 million to 100 million. The European Union declines from 447 million to 419 million.

Global Population Change 2024-2050 showing US growth vs China, Japan, EU decline
The US is the only major developed economy projected to maintain population growth through 2050. Source: UN, CBO

The United States is the only major developed nation projected to keep growing. That's not because Americans are having more children. It's because America still attracts immigrants at scale, and those immigrants have children.

Economic power ultimately rests on people: workers, consumers, taxpayers, innovators. A shrinking population doesn't just mean fewer of each. It means resources redirected from investment to elderly care, from expansion to maintenance, from growth to managed decline. China's dream of overtaking the US economically runs headlong into the reality of an aging, shrinking workforce. Japan's stagnation becomes Europe's future.

This relative advantage isn't guaranteed. It depends on maintaining immigration levels that are currently politically contested. But the structural reality is clear: the demographic bet for American preeminence isn't on fertility. It's on continuing to be the place people want to move to.

Arrows flowing from Northeast to Southwest showing migration patterns
05

The Great Rebalancing: Sun Belt Rise, Rust Belt Fade

The national numbers mask a more dramatic internal reshuffling. The Weldon Cooper Center for Public Service projects that the South and West will capture essentially all population growth through 2040. The Northeast begins absolute population decline between 2040 and 2050. The Midwest starts shrinking even earlier.

Texas, Florida, Georgia, North Carolina: these states will gain congressional seats, electoral votes, economic weight, and cultural influence. The Rust Belt's long decline accelerates from relative to absolute. Cities that built infrastructure for millions will serve populations of hundreds of thousands.

This isn't just about weather and taxes, though those matter. It's about where young people are going, where immigrants are settling, where businesses are expanding. The South and West have younger populations, more growth-oriented politics, and lower costs. The Northeast and Midwest have legacy infrastructure, older populations, and pension obligations that constrain investment.

The political implications are obvious: the Electoral College tilts further toward the Sun Belt. But the economic implications are just as profound. Capital follows people. Talent follows capital. The feedback loop that made the Northeast the center of American economic gravity is now running in reverse.

Diverse mosaic of faces representing majority-minority America
06

Majority-Minority: The End of Demographic Dominance

Around 2045, the non-Hispanic White population drops below 50% of the total. By 2060, it's projected at 44%. No racial or ethnic group will constitute a majority. The United States becomes, in demographic terms, the first major Western nation to transition to a truly pluralistic composition.

Racial/Ethnic Composition showing shift from 2024 to 2060
By 2060, no single racial/ethnic group will constitute a majority of the US population. Source: Census Bureau, Pew Research

The Pew Research Center and Census Bureau project Hispanic Americans will reach 27% of the population by 2060, up from 19% today. Asian Americans will double to 9%. The non-Hispanic White population will shrink by approximately 19 million in absolute terms.

This transformation reshapes everything from consumer markets to political coalitions to cultural identity. Brands built on assumptions about the "average American" need to rethink their core customer. Political parties built on demographic coalitions face realignment. Institutions designed by and for one dominant group will serve populations that don't share that history.

Whether this transition is smooth or turbulent depends on choices made now. Are institutions adapting? Is representation expanding? Are the benefits of growth shared? The demographic transition is locked in. The societal response isn't.

The Math is Done. The Politics Aren't.

These projections aren't predictions. They're calculations based on people already alive, fertility rates already measured, immigration patterns already observed. The demographic future of 2054 is largely determined today. What's not determined is how we respond: whether we build the infrastructure for an aging society, whether we embrace the immigration that keeps us growing, whether we manage the regional rebalancing equitably. The numbers tell us what's coming. They don't tell us whether we're ready.