Economics & Policy

The $97 Billion Question

Do undocumented immigrants boost or burden U.S. GDP? The research is in—and it's more nuanced than the headlines suggest.

Listen
Abstract visualization of labor flows and GDP growth curves
01

The CBO Delivers Its Verdict: Immigration Is a Net Fiscal Positive

CBO building with ascending growth charts

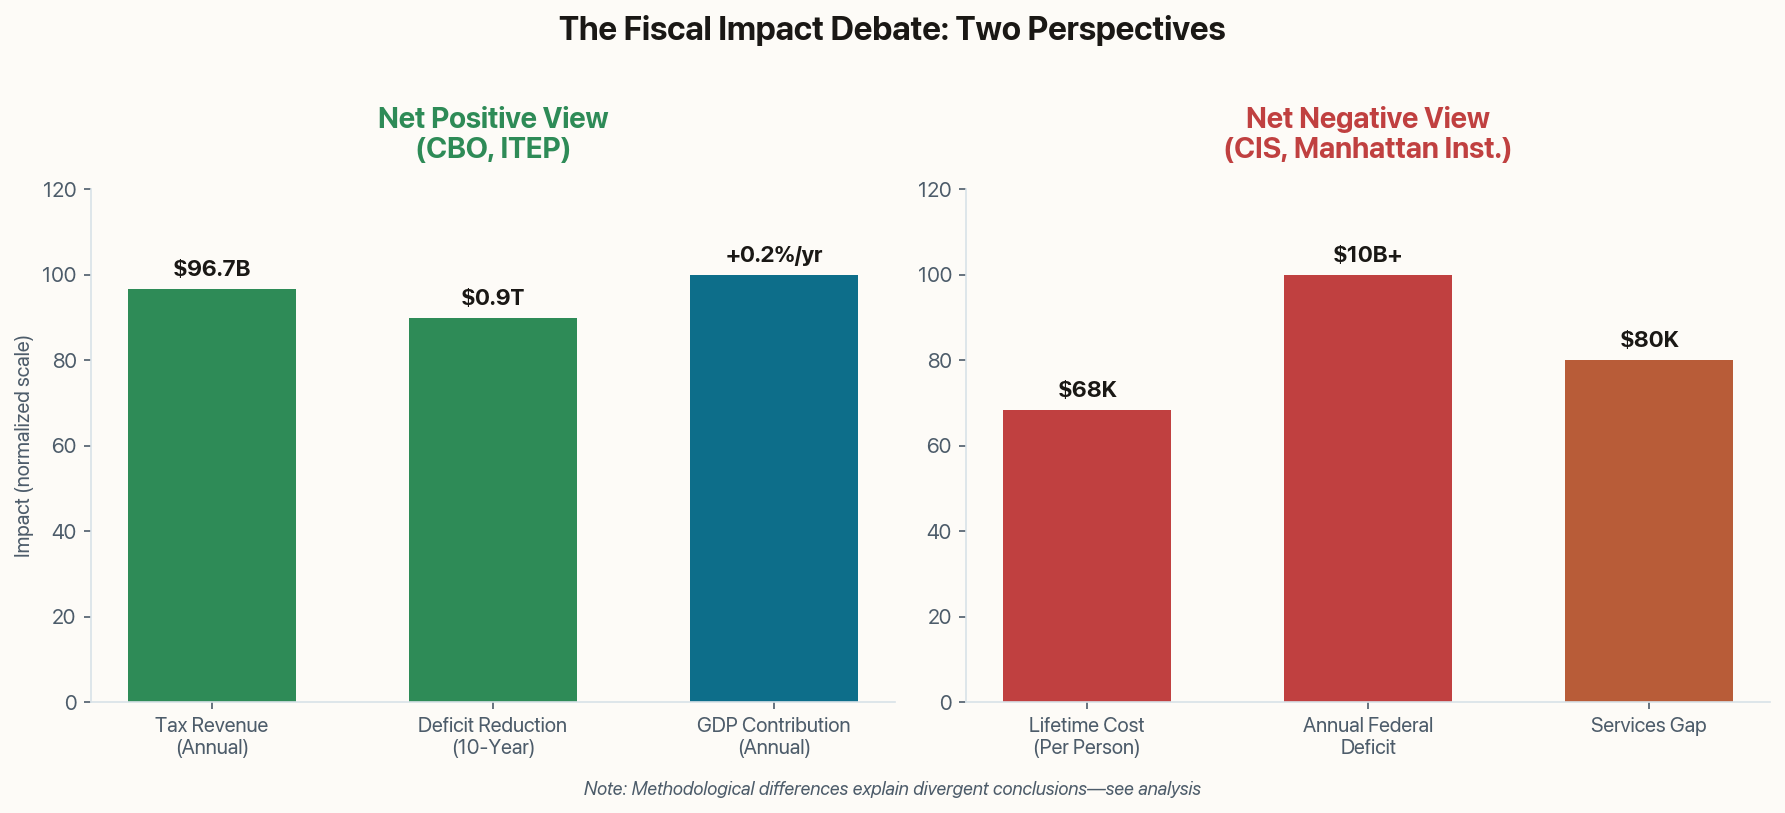
When the non-partisan Congressional Budget Office releases projections, policymakers on both sides typically stop arguing and start reading. The CBO's latest 10-year economic outlook contains a finding that should reframe the entire immigration debate: net immigration—including undocumented arrivals—will reduce the federal deficit by $0.9 trillion over the next decade.

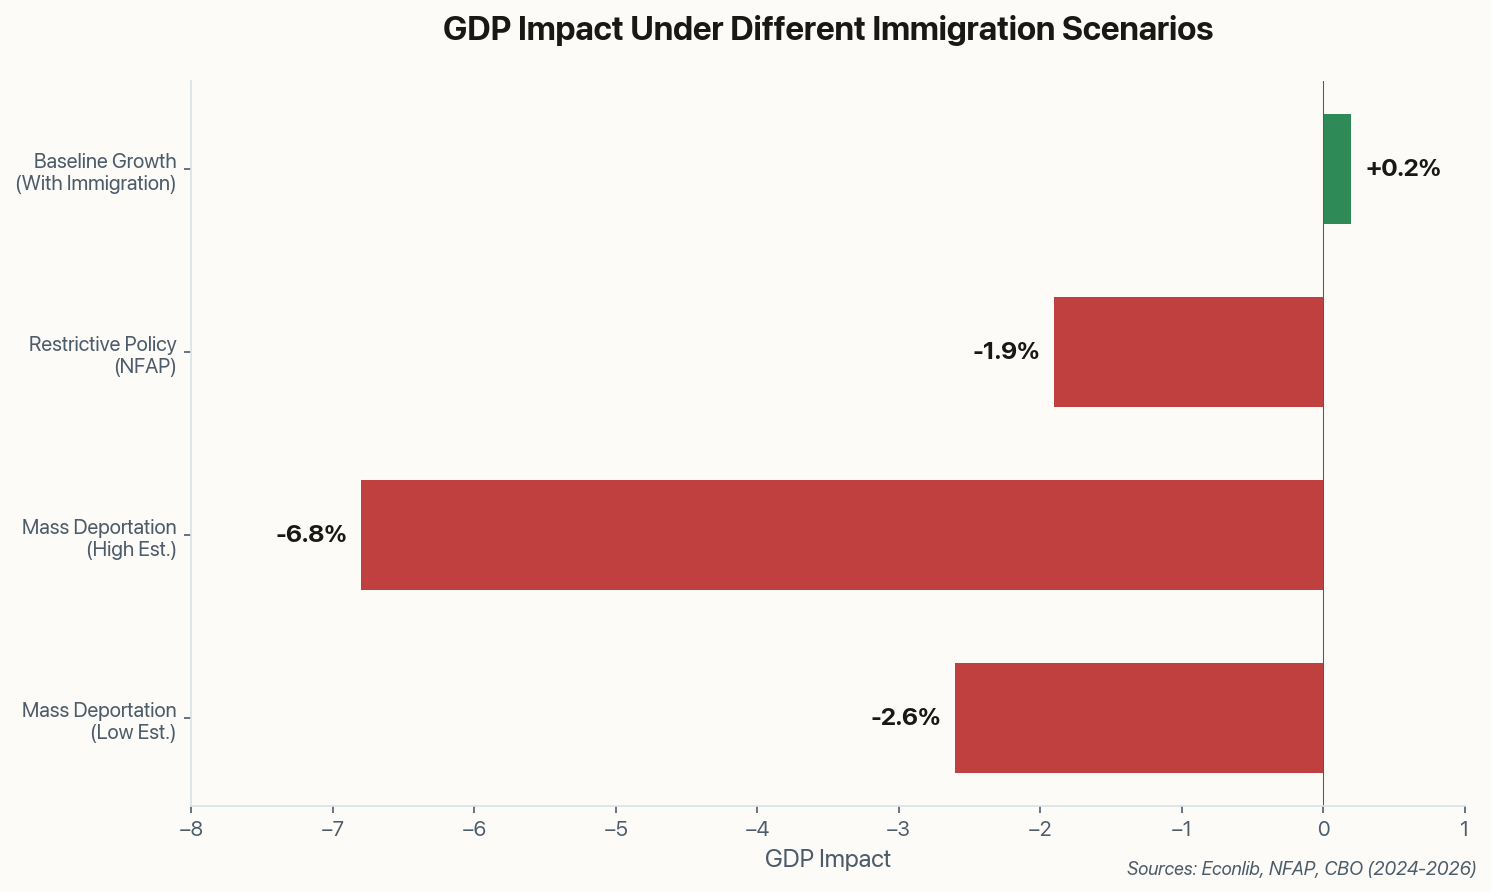
The mechanism is straightforward economics. A larger labor force means higher economic output, which generates more tax revenue. The CBO projects immigration will add approximately 0.2 percentage points annually to real GDP growth—modest in any single year, but compounding into real money over a decade. By 2030, immigration will account for all U.S. population growth as native birth rates continue their decline.

Key finding: "The labor force is projected to be larger than it would be without that immigration... resulting in higher economic output and additional tax revenue."

This isn't ideological framing—it's the baseline projection America's budget planners are using. Any policy that significantly reduces immigration isn't just a cultural choice; it's a fiscal decision with a $900 billion price tag.

02

The Growth Headwinds Are Already Here

Economic headwinds pushing back GDP growth curve

Brookings isn't waiting for policy changes to measure the damage—they're already tracking it. A projected sharp slowdown in net migration is expected to shave 0.2 to 0.3 percentage points off real GDP growth in 2025. That sounds abstract until you translate it: $10 billion to $40 billion in reduced consumption this year alone.

The institution's labor market monitor identifies a scenario where net migration turns negative as a "significant headwind to economic growth." This isn't hypothetical fearmongering; it's what happens when you remove a key driver of labor force expansion from an economy that has already stripped itself of manufacturing jobs and is increasingly dependent on services.

GDP impact under different immigration scenarios
Comparison of GDP impact across policy scenarios: Mass deportation estimates range from -2.6% to -6.8%, while baseline immigration contributes +0.2% annually.

The timing matters. Consumer spending drives roughly 70% of U.S. GDP. Remove millions of consumers—each buying groceries, paying rent, fueling vehicles—and the math stops working for businesses that depend on that demand.

03

The "Deportation Labor Shock" Would Hit Like a Recession

Empty construction sites with abandoned tools

Economists at the Library of Economics and Liberty have modeled what mass deportation would actually look like in macroeconomic terms, and the numbers are stark. Removing 8.5 to 10.8 million unauthorized workers from the economy could shrink U.S. GDP by 2.6% to 6.8%.

For context, the 2008 financial crisis contracted GDP by about 4.3%. The upper-bound deportation scenario would be worse than the Great Recession—except this time it would be a policy choice rather than a market failure.

Critical insight: "A mass deportation event would constitute a negative supply shock, simultaneously contracting output and driving up prices."

The inflationary implications deserve attention. When you remove labor supply from agriculture, construction, and hospitality—industries already struggling to find workers—you don't just get fewer goods and services. You get higher prices for the goods and services that remain. It's the worst of both worlds: stagflation engineered by policy rather than market forces.

Immigrant labor concentration by sector
Construction (25%), agriculture (45%), and hospitality (22%) are particularly dependent on immigrant labor. The construction sector already faces a 500,000 worker shortfall.
04

The $1.9 Trillion Price Tag of Restriction

Economic visualization of trillion dollar loss

The NFAP has put a specific dollar figure on the cost of restrictive immigration enforcement: $1.9 trillion in cumulative GDP loss between 2025 and 2028. That's not a projection about theoretical maximum damage—it's the expected outcome of policies already being implemented or proposed.

Their model shows 2025 GDP growth falling from a potential 2.1% to 1.5% under restrictive scenarios. The labor force could contract by 6.8 million workers by 2028, with 4 million of that loss directly attributable to policies targeting undocumented immigrants.

Here's what $1.9 trillion means in concrete terms: it's roughly equivalent to the entire economic output of California for a year. It's enough to fund Medicare for six years. It's the margin between a growing economy and a stagnant one.

The think tank's analysis is particularly notable because it comes from an organization founded by a former INS commissioner—not exactly a group with anti-enforcement priors. Their concern isn't about immigration enforcement in principle; it's about the economic mathematics of removing millions of productive workers from a labor market that cannot replace them.

05

The Net Cost Argument: What the Other Side's Numbers Show

Fiscal balance scale with public services and tax contributions

Any honest analysis of this question requires engaging with the strongest counter-arguments. The Manhattan Institute—a center-right think tank with serious economists—has produced research showing that the average new undocumented immigrant will cost taxpayers a net $80,000 more than they contribute over their lifetime.

Their argument focuses on a different question than the CBO analysis. While the CBO measures aggregate economic output and tax revenue, Manhattan Institute calculates the lifetime fiscal balance: services consumed (education, healthcare, infrastructure) versus taxes paid. By this measure, existing undocumented immigrants are projected to cost the federal government $225,000 each over the next 30 years.

Dual perspective on fiscal impact
The fiscal impact debate: CBO/ITEP show net positive contributions at the macro level, while CIS/Manhattan Institute focus on per-person lifetime fiscal balance showing net costs.

This methodological divergence explains much of the political disagreement. If you measure GDP contribution, immigration looks like an unambiguous win. If you measure per-person fiscal balance, particularly for low-wage workers who use public services, the picture becomes more complicated. Both sets of numbers can be true simultaneously—the question is which framing you find more relevant to policy.

The analytical gap: "While immigration broadly contributes to economic growth, the fiscal profile of unlawful immigrants specifically remains a net burden on public finances." — Manhattan Institute

06

The $97 Billion They Already Pay—Including to Programs They Can't Access

Tax contribution streams flowing to federal programs

The ITEP has quantified what undocumented immigrants actually contribute to federal, state, and local tax coffers: $96.7 billion annually. That's not an estimate of potential contribution—it's what they're already paying through payroll taxes, sales taxes, and property taxes (directly or via rent).

The breakdown reveals a particular irony. Of that total, $59.4 billion goes to federal taxes and $37.3 billion to state and local taxes. More than a third—$33.9 billion—funds Social Security and Medicare. Programs that, by law, undocumented immigrants cannot access.

Tax contribution breakdown by category
Undocumented immigrants contribute $96.7B annually in taxes. $33.9B funds Social Security and Medicare—programs they cannot legally access.

ITEP calculates that granting work authorization would boost these contributions by an additional $40.2 billion annually—a function of higher wages and fuller tax compliance that comes with legal status. The current system effectively creates a massive subsidy to social insurance programs from workers who will never collect benefits.

This doesn't resolve the fiscal balance debate (services still cost money), but it does undermine the "they don't pay taxes" talking point that dominates public discourse. Nearly $100 billion annually is not a trivial contribution.

The Bottom Line

The research consensus is clearer than the political debate suggests. At the macro level, immigration—including undocumented immigration—contributes positively to GDP growth, tax revenue, and deficit reduction. At the micro level, individual fiscal balances depend heavily on wage levels, service usage, and which costs you count. The honest answer to "net positive or negative?" is: it depends on what you're measuring. But the economic costs of mass restriction are increasingly well-quantified—and they're measured in trillions.