Stock Market 2026

The Valuation Tightrope

Wall Street is unanimously bullish on 2026. The CAPE ratio just hit its second-highest level in 150 years. Both of these things are true.

Listen
Abstract visualization of stock market trends with ascending glass pillars
01

The Magnificent 7 Lose Their Grip

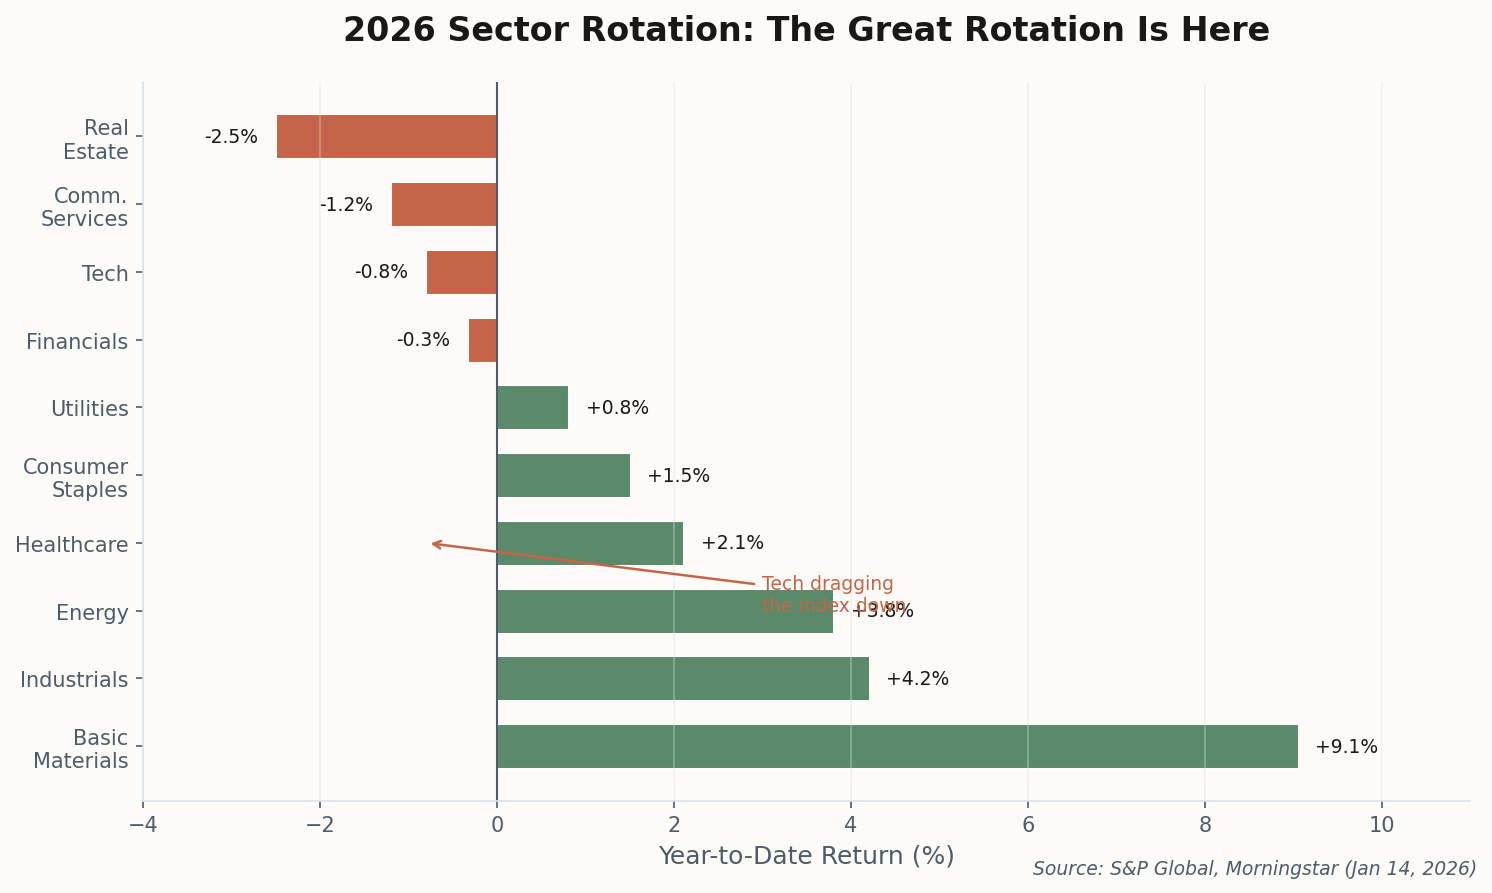
Something strange is happening in early 2026: the stocks that carried the market for three years are now dragging it down. Five of the seven mega-cap tech giants sit in negative territory through mid-January, and the S&P 500 is up just 0.7%—a far cry from the index's usual tech-powered surge.

The numbers tell the story. Nvidia, Apple, Microsoft, Meta, Alphabet, Amazon, and Tesla still account for more than 35% of the S&P 500's total weighting. When they stumble, the index stumbles. And right now, they're stumbling.

The earnings outlook partly explains the malaise. Magnificent 7 profits are expected to climb about 18% in 2026—respectable, but the slowest pace since 2022 and barely better than the 13% rise projected for the other 493 companies. The era of exceptional growth is normalizing, and prices haven't fully adjusted.

Key takeaway: Former Cisco CEO John Chambers predicts 2026 will be "a year of divergence" within the Magnificent 7. Translation: pick your horses carefully.

02

The Great Rotation Has Arrived

"We are most definitely seeing a rotation, and it has picked up some momentum from the end of last year," says State Street's Michael Arone. The data backs him up: basic materials lead all sectors with a 9% gain, followed by industrials and energy. Meanwhile, tech and communication services—the 2024-2025 darlings—are underwater.

2026 sector YTD performance showing basic materials leading at 9% while tech lags
Sector year-to-date returns as of January 14, 2026. The rotation away from tech is real.

The narrative has shifted. Industrials and financials are catching bids as investors position for a more traditional economic cycle. Healthcare is quietly outperforming tech since June 2025, buoyed by solid earnings, M&A activity, and easing regulatory concerns. Schwab now rates Communication Services, Industrials, and Health Care as "Outperform."

The strategic implication: maintain core tech holdings but broaden exposure. Analysts suggest adding rate-sensitive sectors like Financials and Real Estate, plus Industrials and Materials companies riding the AI infrastructure buildout.

03

Tariffs: The 16.8% Tax Nobody's Pricing

President Trump's sweeping tariffs have raised the average tax on U.S. imports to 16.8%—the highest level since 1935, according to the Budget Lab at Yale. The stock market hasn't really noticed yet. It probably should.

Goldman Sachs calculates that U.S. companies and consumers paid 82% of the tariff costs in October 2025, and 67% of the burden will fall on consumers alone by July 2026. Inflation has accelerated every month since the baseline tariff took effect in April. The ISM reports U.S. manufacturing activity contracted in December—the 10th consecutive decline—with the chair explicitly blaming "uncertainty caused by tariff costs."

And yet, the economy keeps growing. Why? AI infrastructure spending has so far offset the negatives. "In the first half of 2025, AI-related capital expenditures contributed 1.1% to GDP growth, outpacing the U.S. consumer as an engine of expansion." The question is whether this offset can continue.

The risk: Unemployment is at a four-year high and (excluding the pandemic) hiring slowed more profoundly in 2025 than any other year since the Great Recession in 2009.

04

CAPE at 39: The Dot-Com Déjà Vu

The S&P 500's CAPE ratio—the cyclically adjusted price-to-earnings ratio popularized by Robert Shiller—hit 39.4 in December. That's the second-highest reading in 150 years of data, trailing only the October 2000 dot-com peak of 44.

CAPE ratio historical chart showing current 39.4 as second-highest ever
The Shiller CAPE ratio at 39.4 sits just below the dot-com peak. Historical average is around 17.

History offers a sobering precedent. After recording a monthly CAPE above 39, the S&P 500 has dropped an average of 20% during the next two years and 30% during the next three years. The index has never generated a positive three-year return under those conditions.

Bulls counter that today is different: current valuations are supported by earnings growth and business fundamentals, not just speculation. AI-driven productivity gains could expand profit margins in ways not captured by backward-looking metrics. The debate is unresolved, but the historical warning lights are flashing.

05

Wall Street's Unanimous Bull Call

Not a single one of the 21 prognosticators surveyed by Bloomberg News is predicting a decline in 2026. The average year-end S&P 500 target is 7,555, implying another 9% gain. Oppenheimer is the most bullish at 8,100; Bank of America the most cautious at 7,100.

Wall Street S&P 500 year-end 2026 targets ranging from 7,100 to 8,100
Every major Wall Street firm sees gains ahead. The range: 4% to 18% upside from current levels.

The bull case rests on three pillars: continued AI-driven earnings growth (consensus expects ~12% EPS growth in 2026), a Federal Reserve likely to cut rates once or twice this year, and supportive fiscal policy. Goldman Sachs projects S&P 500 EPS of $305 in 2026, with 70 basis points of margin expansion.

The Fed backdrop is key. The CME FedWatch Tool shows just 16% odds of a January cut, but those odds rise to 45% by April. The dot plot projects one more 25-basis-point cut in 2026, bringing the target range to 3.25%-3.5%. Add Jerome Powell's term expiring in May and a new Fed Chair taking the reins, and monetary policy becomes both a catalyst and a wildcard.

The contrarian take: When Wall Street is unanimous, history suggests caution. The last time bears were this scarce, it didn't end well.

The View From Here

Earnings growth is real. Valuations are stretched. The rotation is underway. These aren't contradictions—they're the ingredients of a stock-picker's market. The days of "just buy the index" may be numbered.